Analyze important decision metrics, and empower teams to self-serve and collaborate on analyses. All this – in a single platform that connects spreadsheets, analyses and dashboards.
What Auto-analysis Does
Auto-analysis transforms a lengthy and error-prone manual setup for spreadsheet analyses into a 1-click-job, helping you create insightful reports ready to be shared with others.
Get Started with Auto-analysis
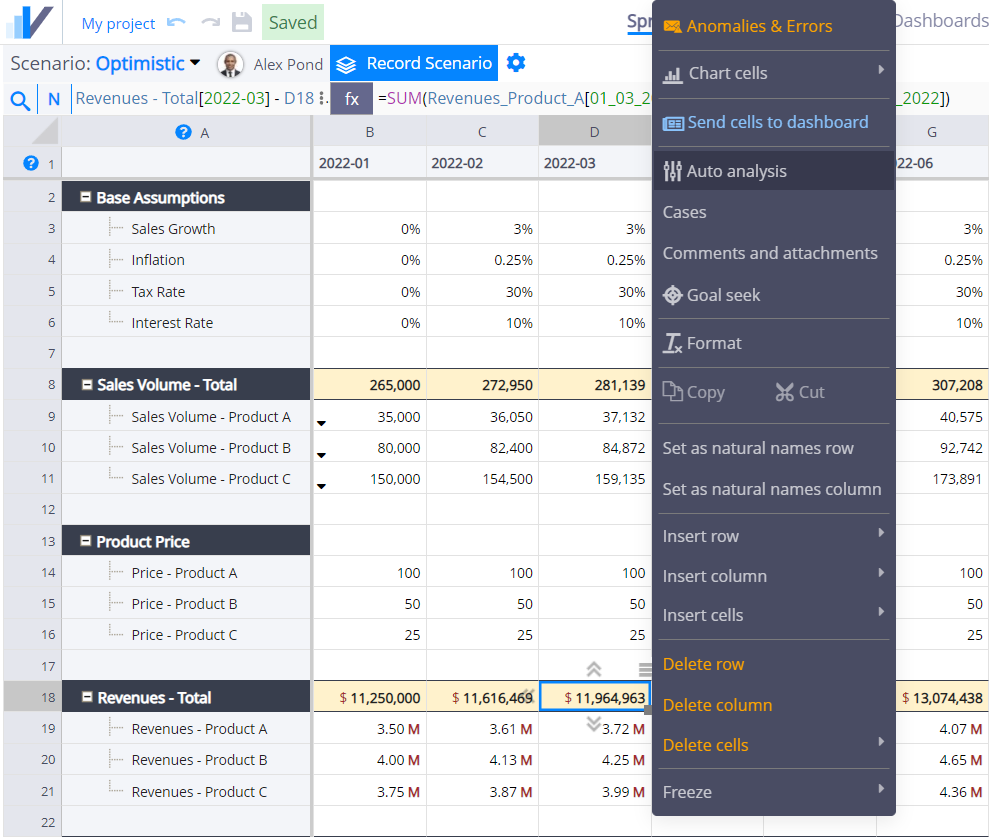
First, import your Excel spreadsheet, or create a project in Visyond from scratch.
Right-click on the cell with the decision metric you want to analyze (e.g. Revenues) and select Auto analysis from the context menu.
Analyses Types
Visyond will automatically run the following analysis using heuristics. Afterwards, you have an option to customize the settings of each analysis and re-run it.
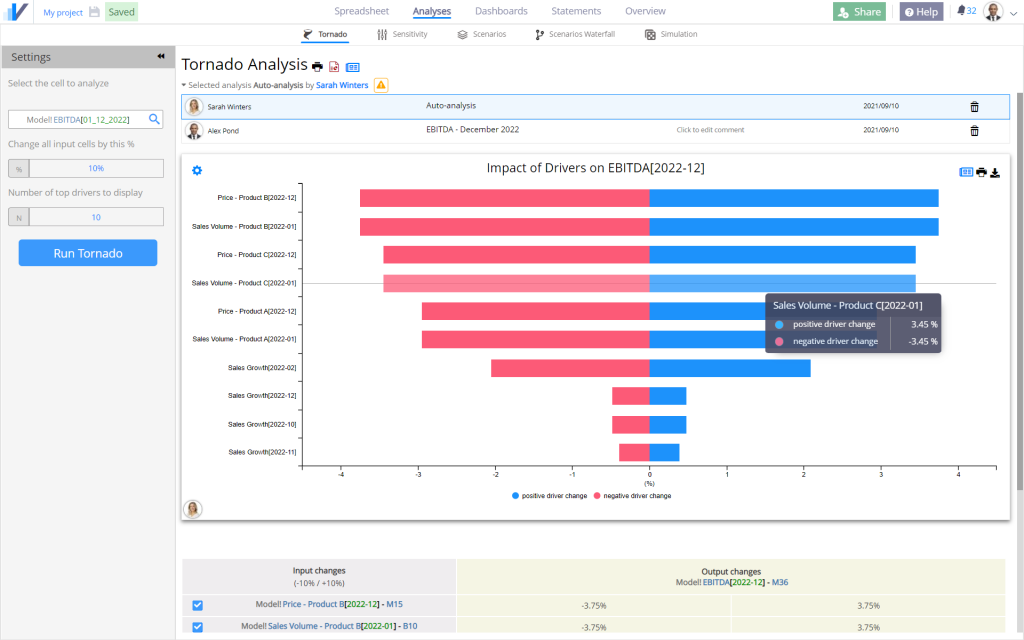
Tornado
Tornado analysis shows the most important inputs for the selected output cell.
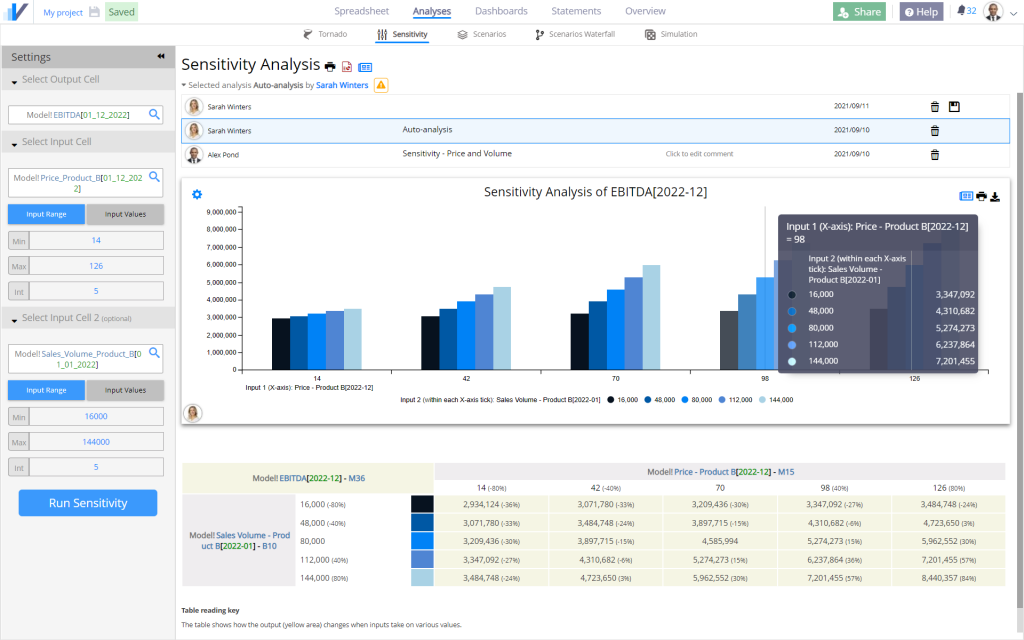
Sensitivity
Sensitivity analysis will heuristically run a two-way sensitivity on the two most important inputs by varying them from a minimum of the Current Value – 50% and a maximum of Current Value + 50%.
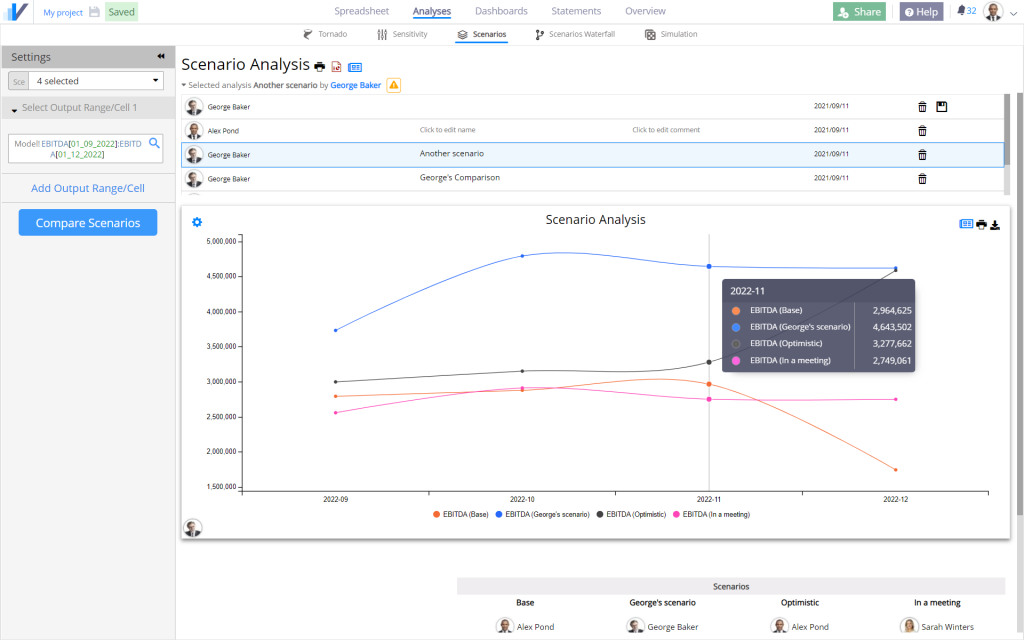
Scenario
Scenario analysis will heuristically vary each of the top 5 inputs by -/+ 50% and create new Cases with these values.
We call an ‘increasing case’ a case that increases the output value. A ‘decreasing case’ a case that decreases the output value.
Note that we do not use terms ‘optimistic’ or ‘pessimistic’ as we can’t make an assumption of whether you consider the value increase of the output cell a good or bad thing (think about costs going up).
An ‘Increasing Scenario’ and a ‘Decreasing Scenario’ are constructed by switching the 5 most important input cell to their increasing and decreasing case respectively.
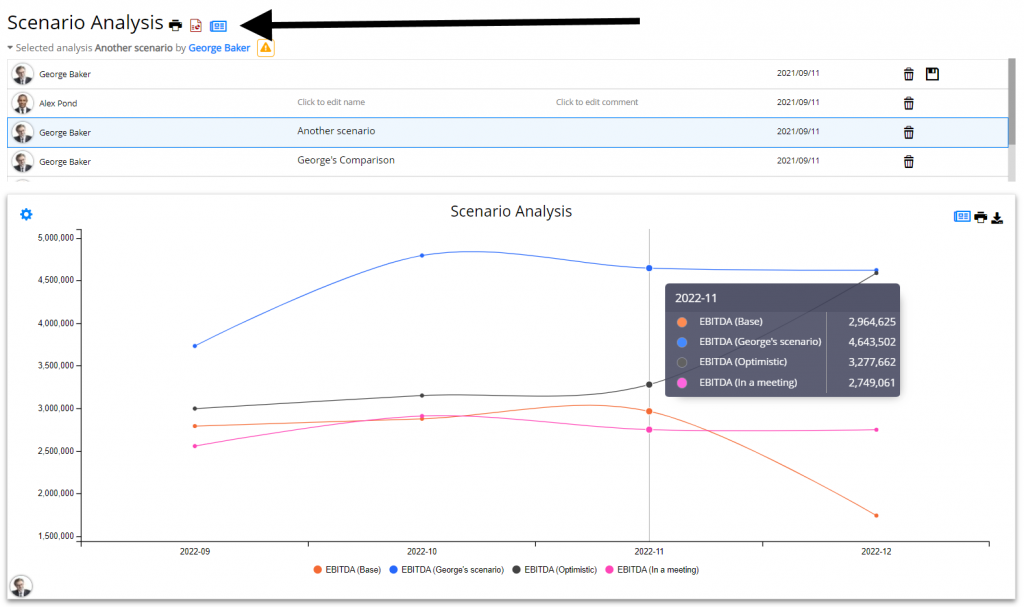
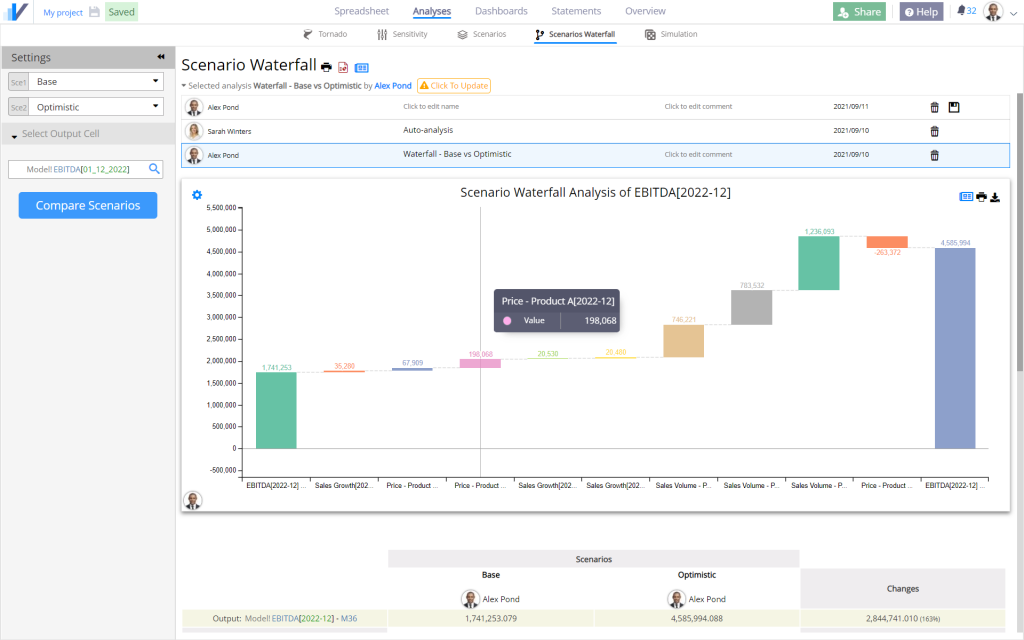
Scenario Waterfall
Scenario Waterfall analysis offers a visual breakdown of what cells have changed between two scenarios and the contribution of each change to a selected output cell.
In the example below, you can see what cells changed (and by how much) to take the EBITDA from its lesser value in the Base scenario to the greater value in the Optimistic scenario.
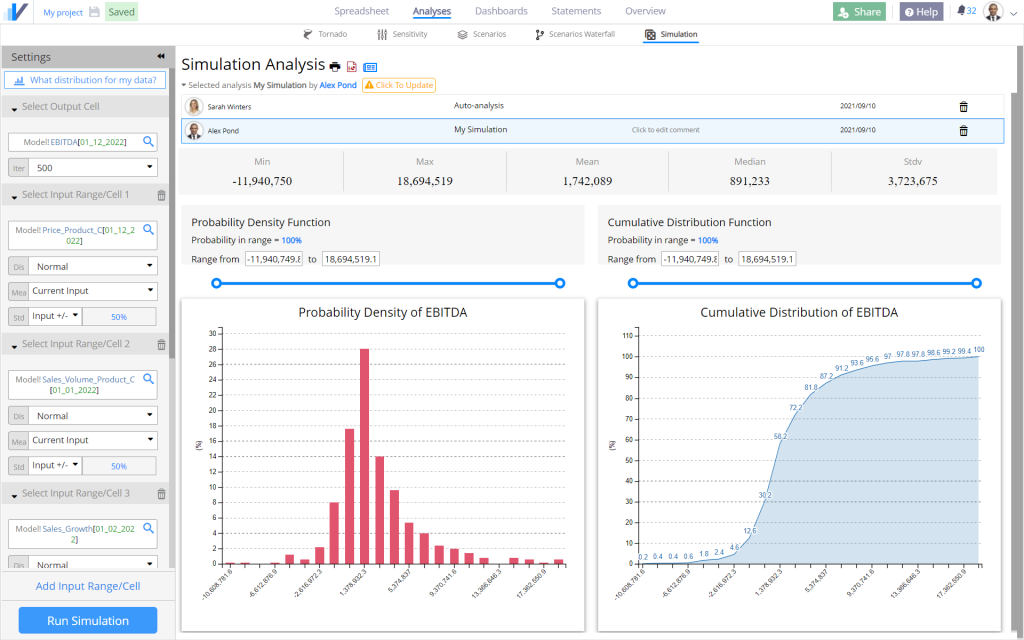
Monte Carlo Simulations
Monte Carlo simulations heuristically models the top 5 input cells as Normal Distributions with a mean set on their base value and a standard deviation of 50% of the base value.
This can be inaccurate (e.g., imagine inflation) but gives you the opportunity pick another probability distribution (e.g., Triangular Distribution) that is more appropriate for your situation.
Present Your Analyses
After running the analyses you can add it to an interactive dashboard that you can share with others.
Alternatively, you can export each analysis to PowerPoint or save as .pdf (learn more about exporting projects here):