Impact, or Tornado, Analysis will tell you how much a selected cell is sensitive to changes in its precedent cells. You will be able to answer questions like: ‘By what percentage this cell changes when its drivers, one by one, change by x%?
Only numeric cells (i.e., cells containing numbers or percentages) are considered as output drivers; empty cells or cells containing errors, dates, booleans, strings and formulas are not.
After Tornado, you can run Sensitivity Analysis to analyze in detail the impact of the most important drivers.
A Tornado chart is simple to read and understand, and will help you present with impact.
Setting up Impact Analysis (Tornado)
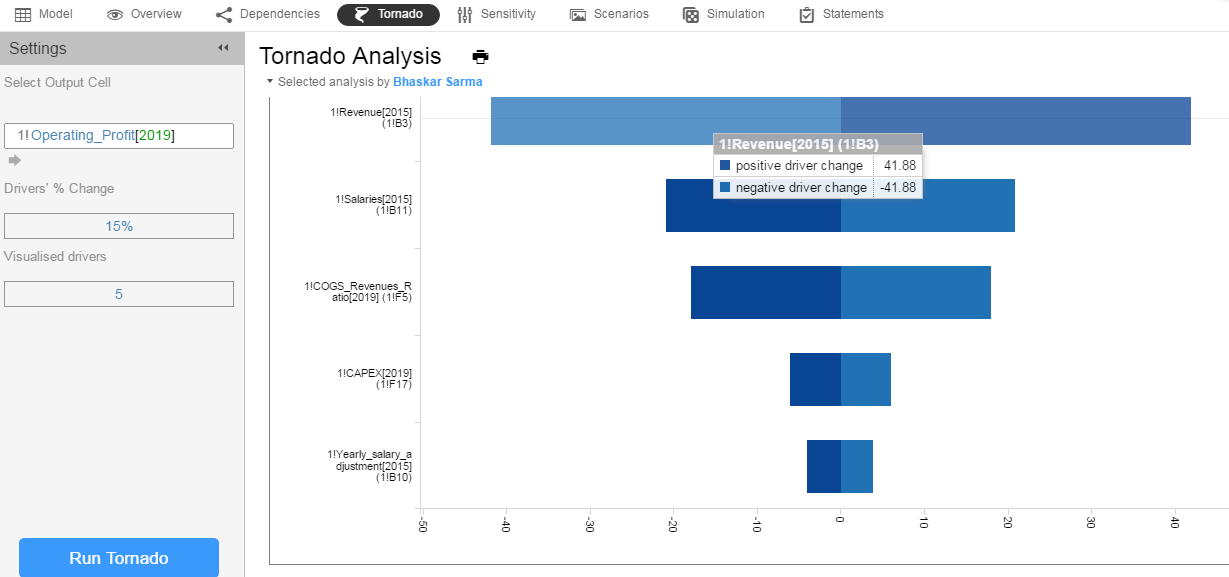
To run Tornado Analysis click on Tornado in the main menu and in the Settings pick the output cell, select the % change of drivers, and the number of drivers you want to consider in your analysis. Click on the Run Tornado button and voila!
To see how much the output changes based on the change of driver input, hover the cursor over the corresponding bar graph.
Customizing Tornado Charts
To customize your Tornado chart go to the right and expand the Chart Settings side-panel.
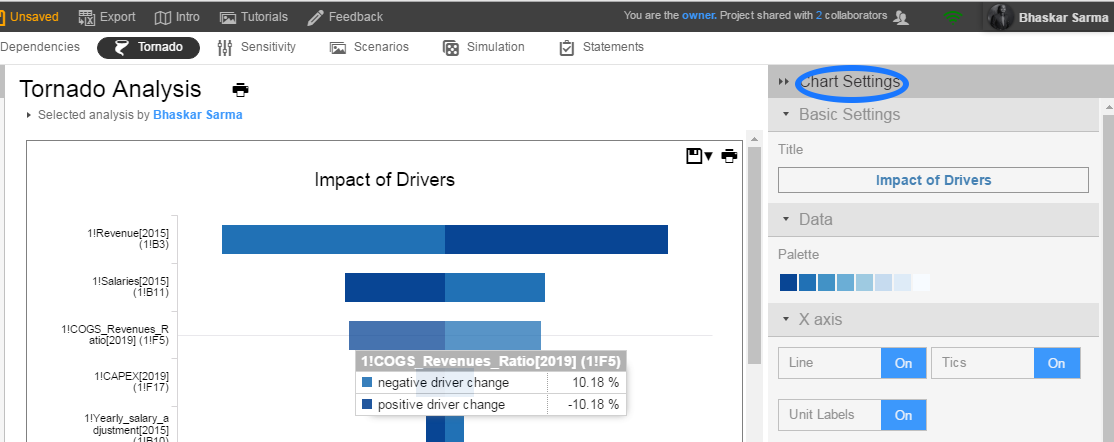
In the Chart Settings you can:
- Change the title of the chart (Basic Settings)
- Change the colors (Data)
- Toggle on/off Line, Tics, Unit Labels and add Unit Type (X-axis)
- Toggle on/off Line and Tics (Y-axis)
- Add/remove grids, labels, zero line, and legend (Options).
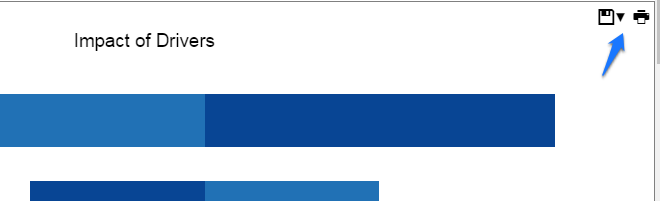
You can save or print your analysis by hovering the cursor near the top right corner of the chart.
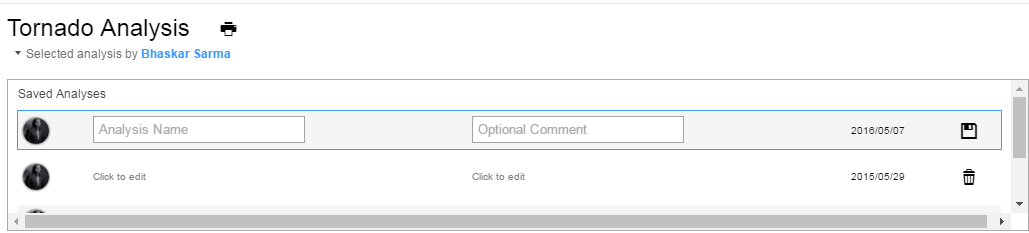
All Tornados run by you or your collaborators are listed at the top, along with their names and optional comments.
If you are working with a lot of data, Tornado analysis may take some time (especially if you are running it on a mobile device).