What a Monte Carlo Simulation Does
Monte Carlo Simulation replaces the input(s) with random variables with a specified distribution and it shows the output cell (and its descriptive statistics) when the input(s) have the selected probability distributions.
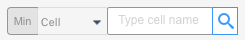
The settings menu requires you to choose a cell you want to analyse and the drivers that you want to model probabilistically.
From the setting menu you can select the number of iterations (the higher the number the lower the standard error but the longer the simulation time) and click on Run Simulation.
This can be done on your tablet or smartphone.
How to use Monte Carlo Simulation to Manage Uncertainty and Risk
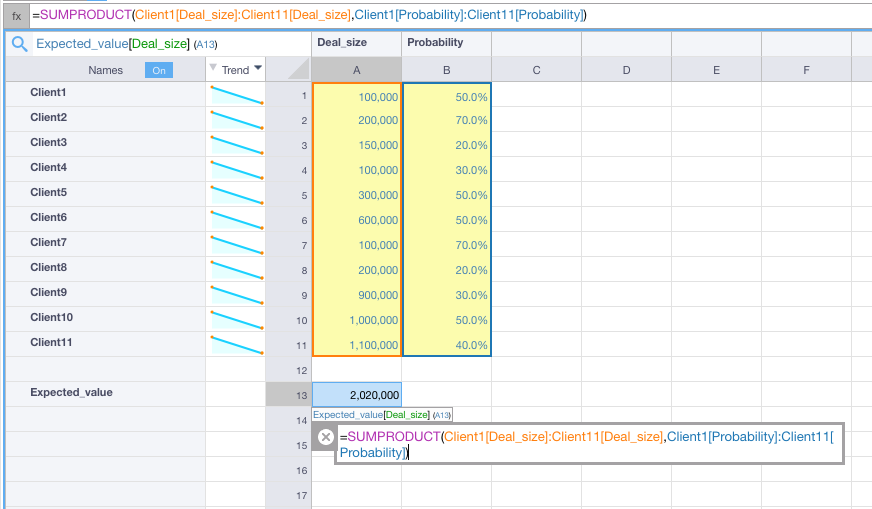
Imagine you want to forecast the value of your sales starting from a list of potential customers, the expected deal size and the probability to close the deal.
Your model may look like this, where you calculate the Expected Value as a weighted average of the Deal Sizes.
You are obviously not sure all will play out that way and want to test what would happen should one or more assumptions change. You may do this by using expert advice and produce deterministic cases and scenarios.
It is also interesting to observe the probability distribution and descriptive statistics of the Expected Value by recalculating it many times, each time replacing input values with random samples from appropriate probability distributions.
Running a Simulation
Below you will find information on how to customize Monte Carlo simulation settings.
You can also run Auto-analysis on a given cell to get a ‘quick and dirty’ simulation you can tweak afterwards.
Setting Iterations
Decide how many times you want the output cell to be recalculated. The more iterations the lower the standard error and the longer the simulation will take.
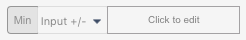
Setting Input Cells
If you want to assign different probability distributions to each input, you will have to add multiple input fields.
For each input field setup the probability distribution and its parameters.
For example, let’s assume that deal size for Client 1 has a Uniform Distribution with minimum of 50,000 and maximum of 150,000, and that deal size for Client 2 has a Triangular Distribution with minimum of 150,000, a mode of 200,000 and a max of 250,000.
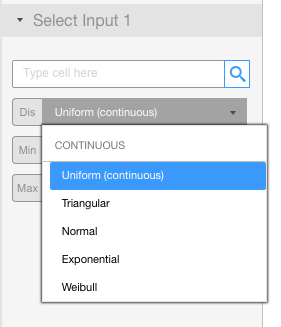
Probability Distributions
Visyond supports the most common probability distributions that you can see by clicking on the drop-down menu below.
You can read about probability distributions on this Wikipedia article.
Visyond supports the following distributions:
Continuous
- Uniform
- Triangular
- Normal
- Exponential
- Weibull
- Lognormal1
- Lognormal2
- Student
- F-distribution
- Chi-squared
- Erlang
- Gamma
- Pareto1
- Pareto2
- Laplace
- Rayleigh
- Pearson5
- Pearson6
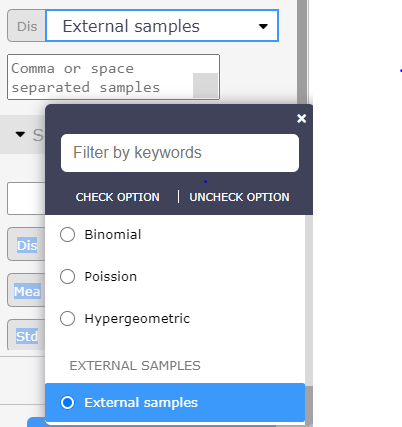
Discrete
- Uniform
- Geometric
- Binomial
- Poission
- Hypergeometric
External Samples
Visyond also allows to use external samples: you can generate samples elsewhere (e.g., using any random number generator) and paste them into Visyond by selecting the option “External samples”.
If you would like us to support other distributions, please contact us.
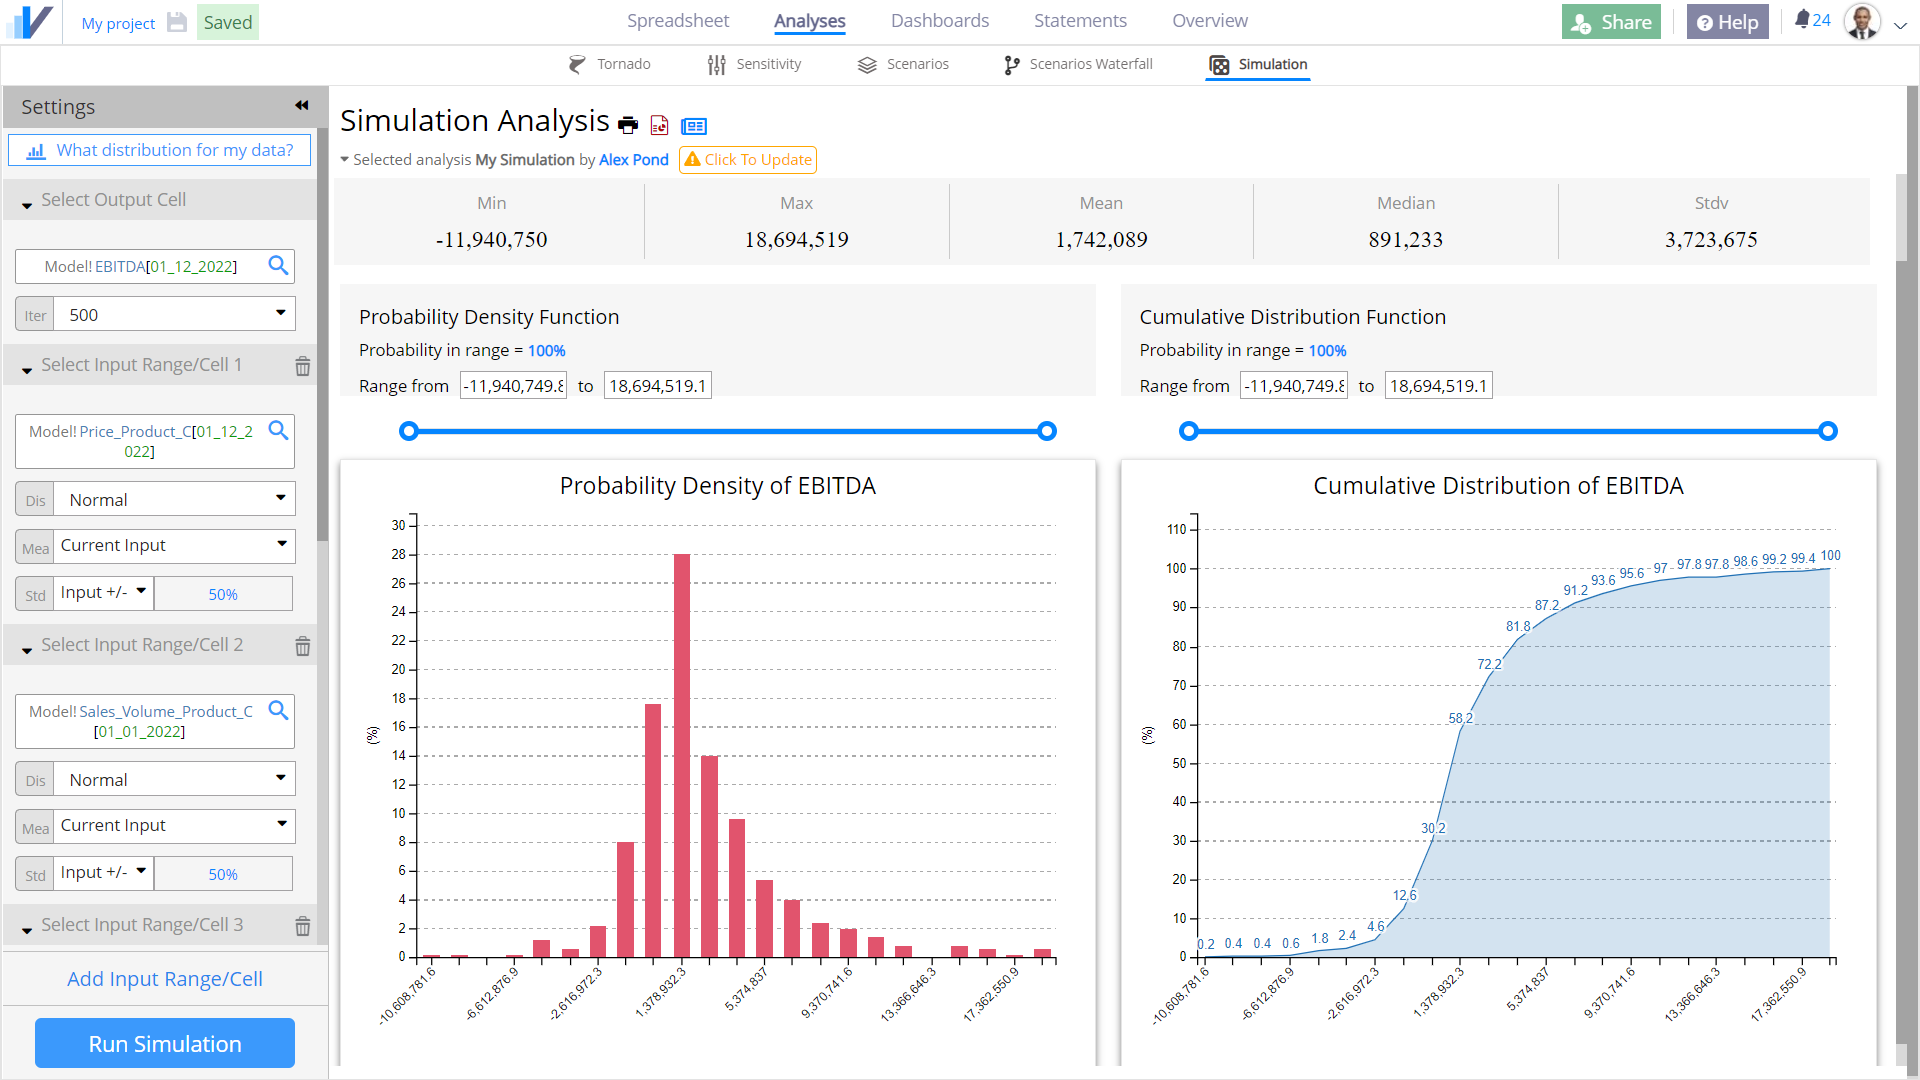
Understanding the Results
Now click on RUN SIMULATION.
Visyond generates descriptive statistics, probability density function and cumulative distribution function.
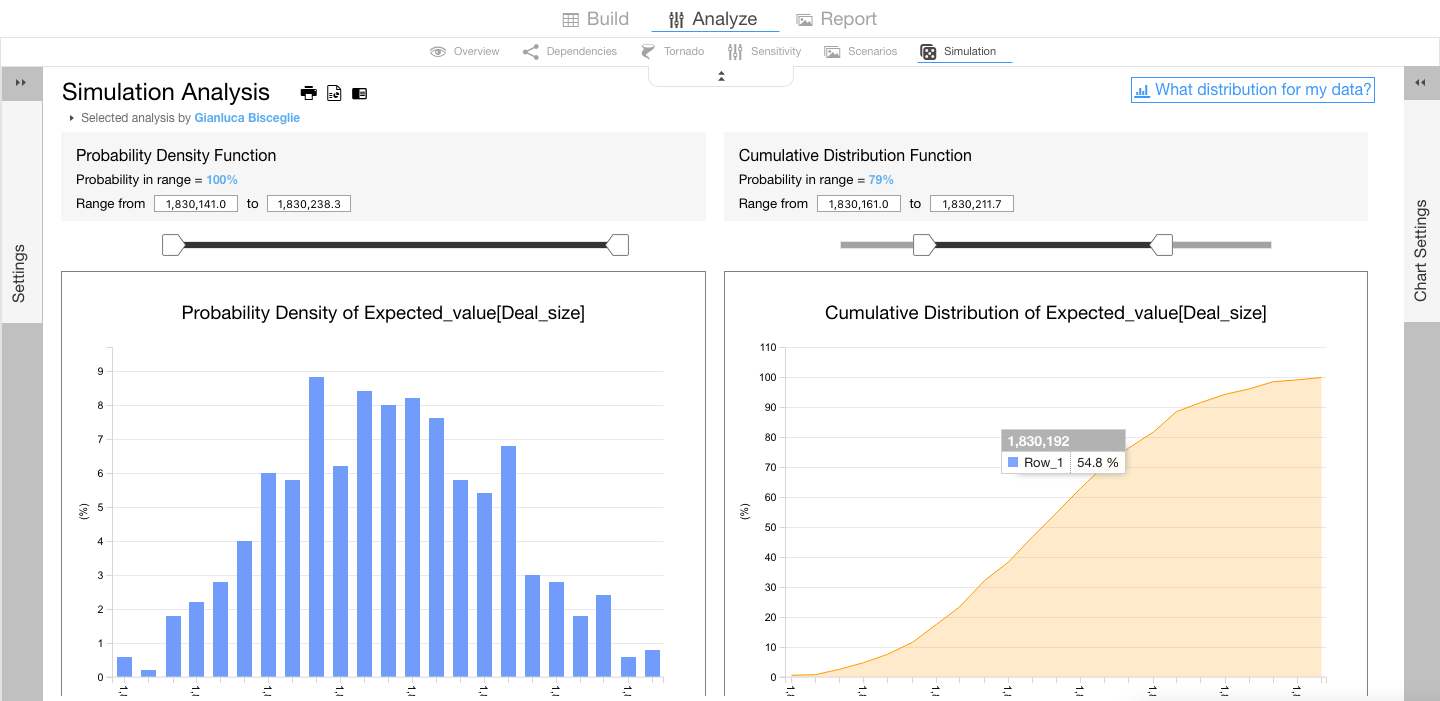
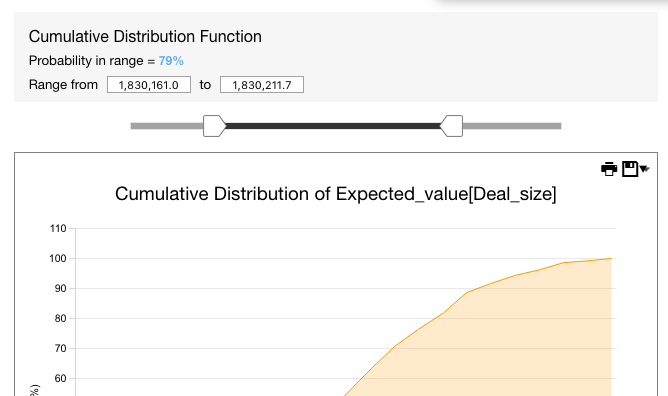
You can use the sliders to know what is the probability that the value of the output cell (e.g., the Expected Value of sales) is between two values.
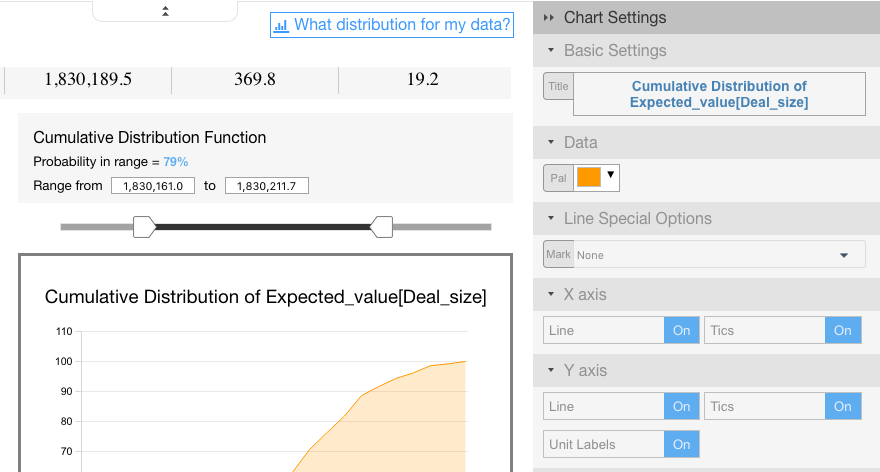
You can also customize the charts before printing them or sending them to PowerPoint or Visyond Slides.
Other Ways to Set Distribution Parameters
You can set the value of any distribution parameters in the following ways:
- As a straight value: we used this input type in the example above
- As a cell: you can enter a cell reference where you have the value you want to use
- Reusing the current value of the input cell
- Varying the current value: the value in the input cell, +/- the value you enter here, will be used. If you enter a percentage value, the input value will be changed by that percentage.
Setting Input Cells in Bulk
In this example we have set manually values for the distributions’ parameters.
This is impractical when you have a range of values that follow the same distribution and with parameters that can vary relative to the current value in the grid using the options described above.
For example, select the range and tell Visyond to use, for each cell in the range, the current value +/- 50% .
Distribution Fitting: How to choose a Probability Distribution for Your Input Cells
If you do not know what probability distribution is more appropriate for a certain input, click on the button What Distribution for my Data? and paste you historical data.
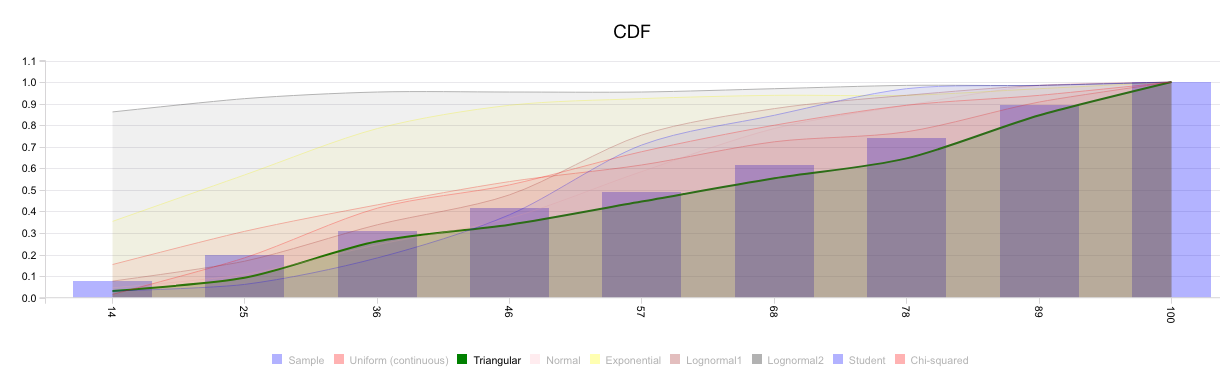
Visyond will show you the cumulative distribution function of the historical dataset and the major theoretical distributions, so you can visually decide what is the best fit. In this example, it appears the historical samples may be part of both a uniform and a triangular distribution.
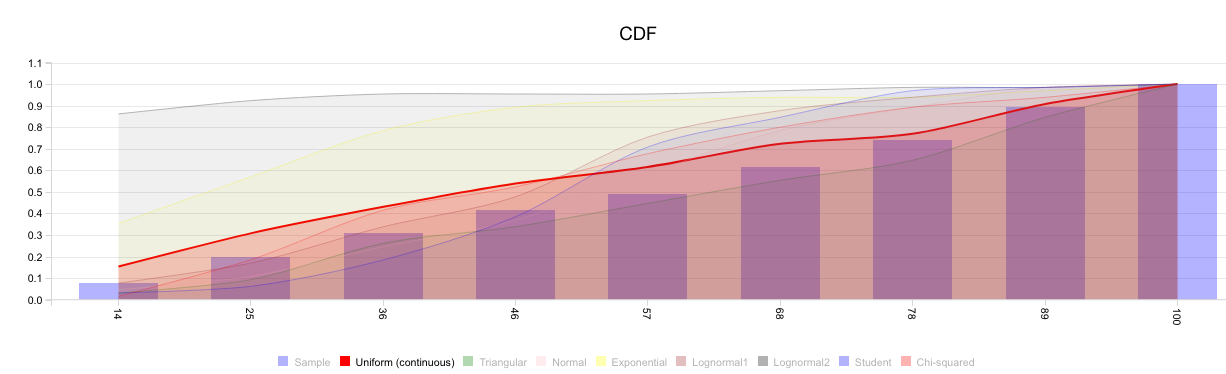
This is confirmed by the goodness of fit table which tells us how many tests (if any) each distribution wins.
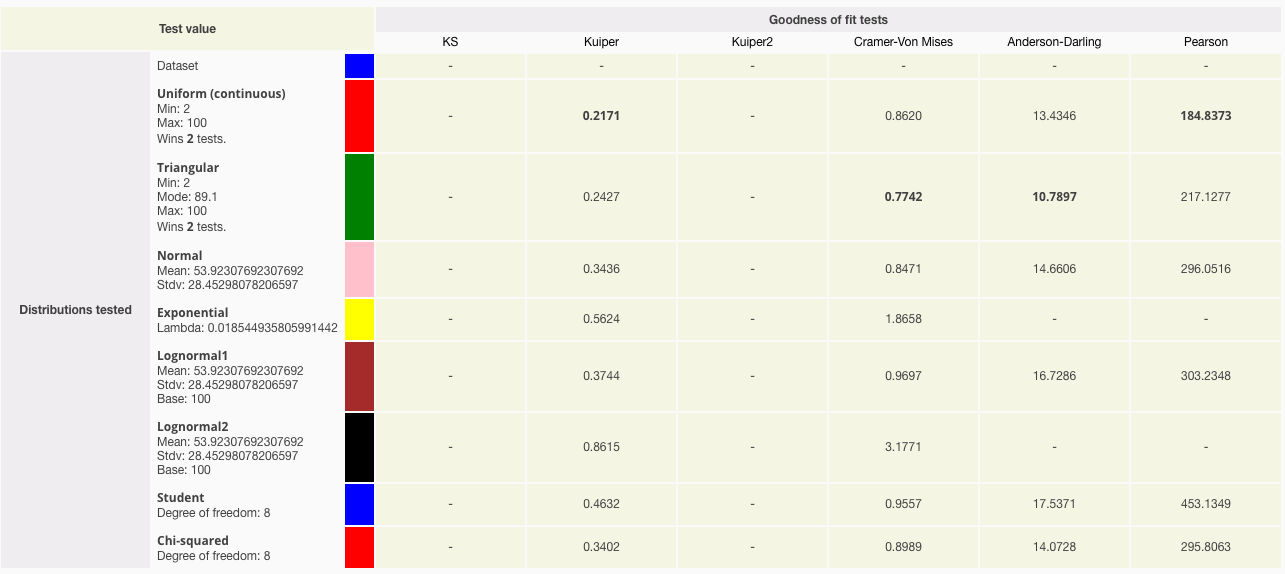
So you can either model this input as a:
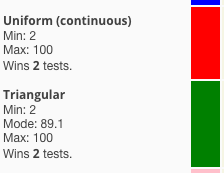
- uniform distribution with min 2 and max 100, or
- triangular distribution with min 2, mode 89.1, and max 100.
Based on your understanding of the data, it should be easy to pick the most appropriate distribution.