Compare scenarios, create forecasts and update budget vs actual in real time during meetings or presentations, turning it into a truly collaborative experience.
Creating, Updating and Managing Scenarios
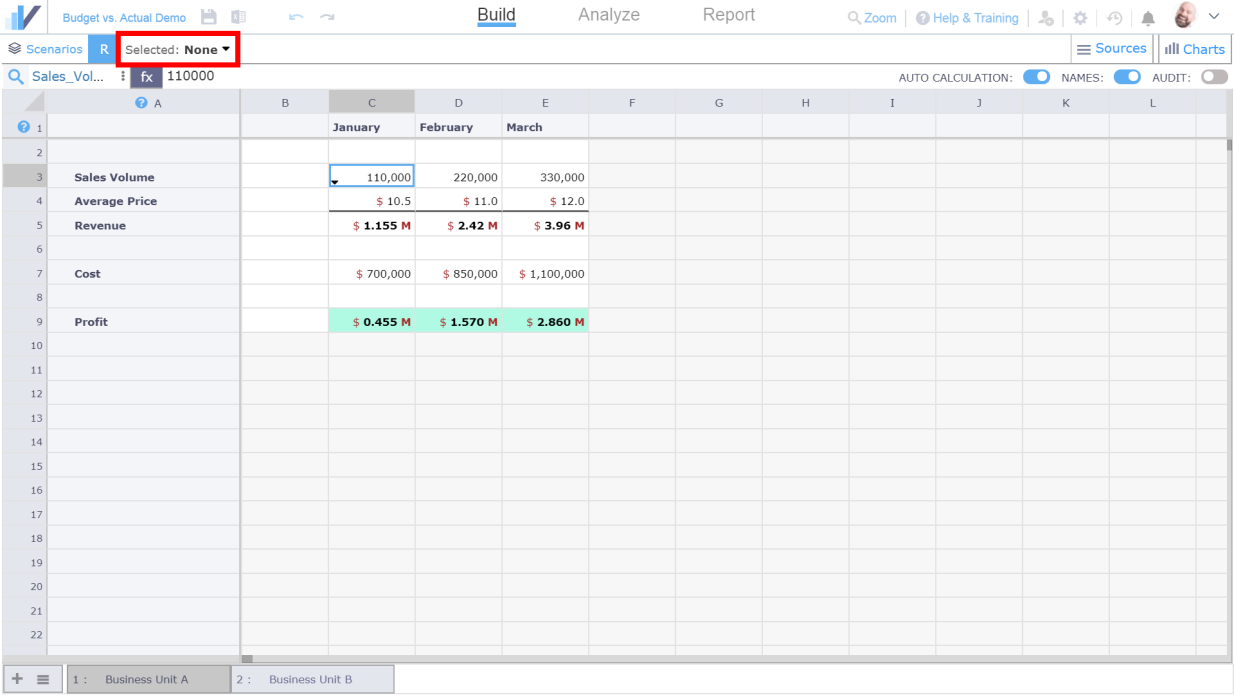
Default State of the Spreadsheet
When you start working on your spreadsheet, you will see that there is no scenario selected by default. In other words, you will see the Default values of the spreadsheet:
To edit scenarios, open the Scenario Management panel:
Note the drop-down icons appearing for cells that have multiple cases (values in different scenarios).
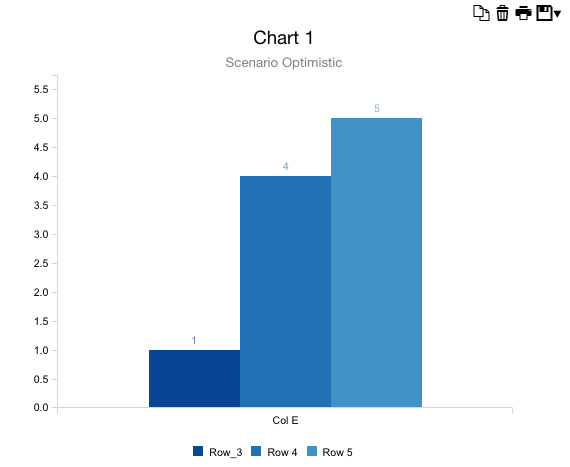
Also the charts will display the scenario name under the title so that you will not be wondering under which assumptions you took that printout:
You can switch scenarios and see how cells are switching to the value or formula linked to the new scenario, and how charts update.
Combining Multiple Scenarios
You can also create new scenarios by combining two or more of existing scenarios.
For example, let’s assume that:
- Richard created a scenario that drives revenue assumptions
- Rachel created a scenario that drives cost assumptions
- Your believe that a realistic scenario is when Richard’s and Rachel’s scenarios are simultaneously active.
In the Scenario panel:
- Click on the drop-down and select Richard’s Scenario and Rachel’s Scenario
- Click on Combine button
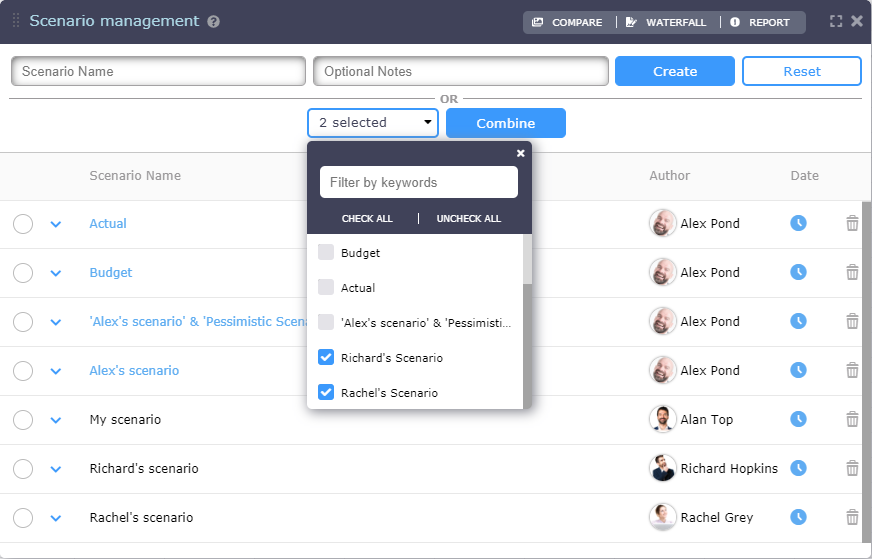
The new scenario name will be an automatic concatenation (you can edit it) of the ones combined (e.g., “Richard’s Scenario & Rachel’s Scenario“).
Comparing Scenarios from the Scenario Drop-down and Panel
Click on the scenario drop-down to select scenarios and see changes in spreadsheets and charts or use Scenario Management panel:
Running Scenario Analysis and Comparing Scenarios
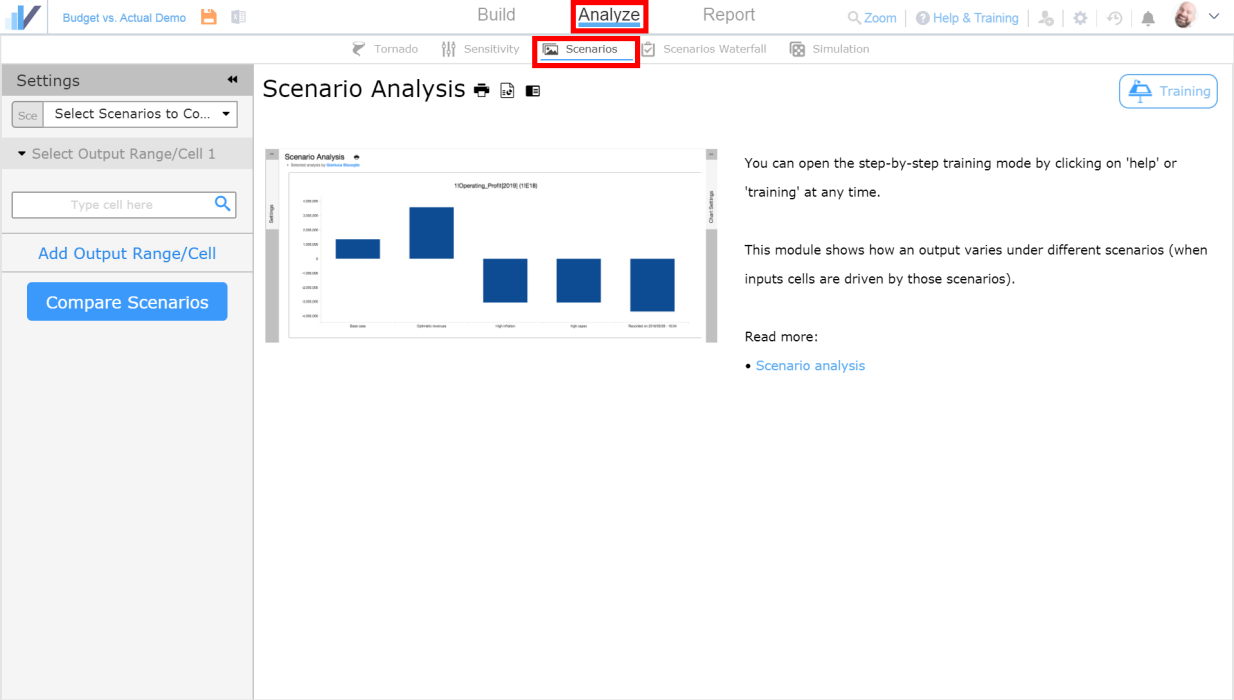
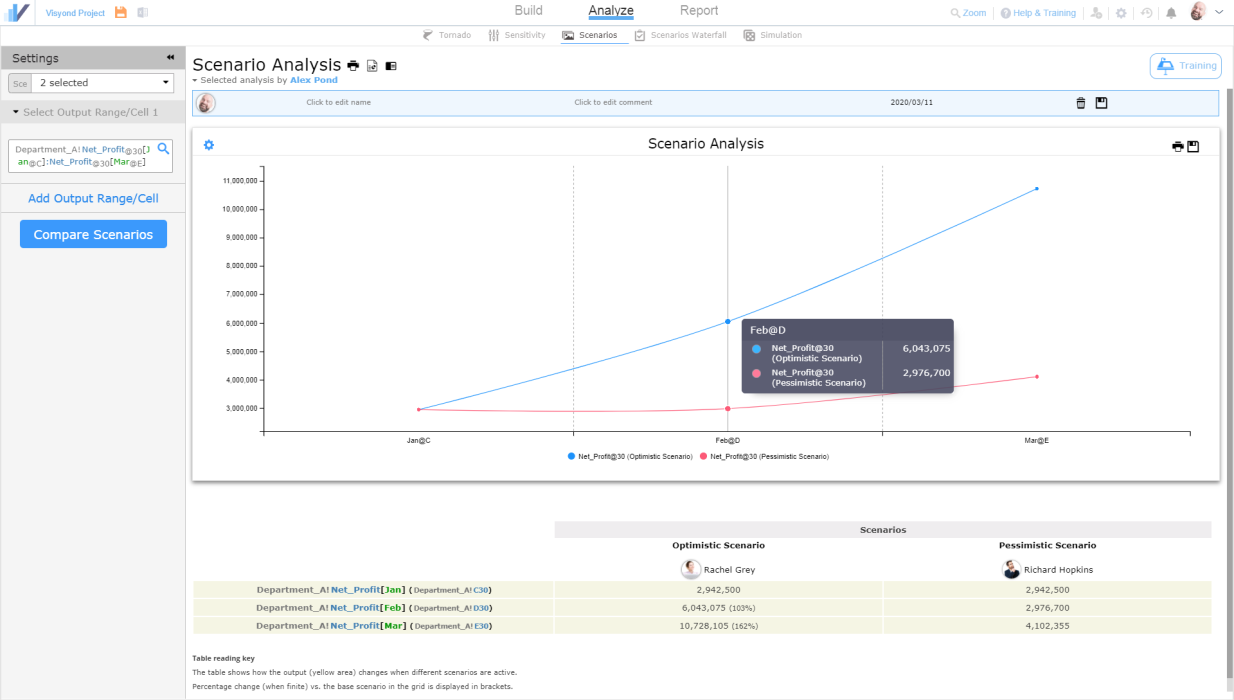
Scenario analysis shows how an output varies when input cells are driven by certain scenarios.
Going to the Analyze tab, and then to Scenarios tab, you can compare scenarios side by side, automatically generating a chart and a variance table ready to be printed, exported or placed on the presentation slide.
Setting up Scenario Analysis requires only the selection of the scenarios to compare, the output cells to analyse, and clicking the Compare Scenarios button.
Comparing Ranges of Formula Cells
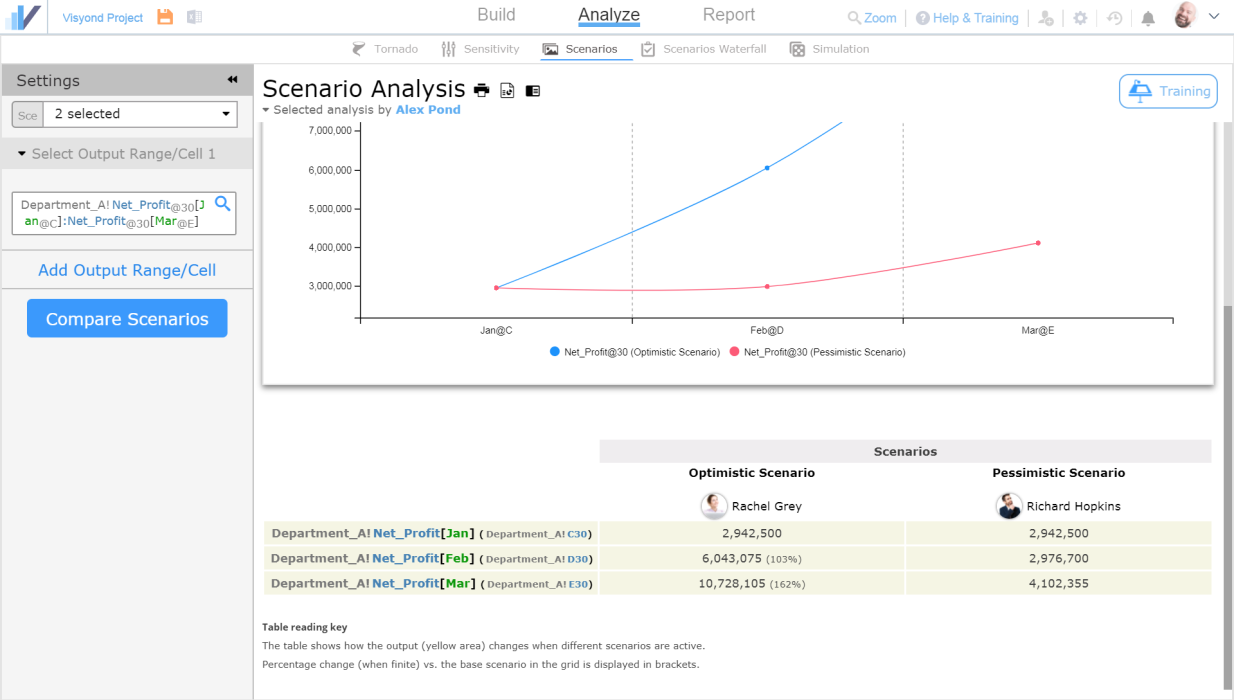
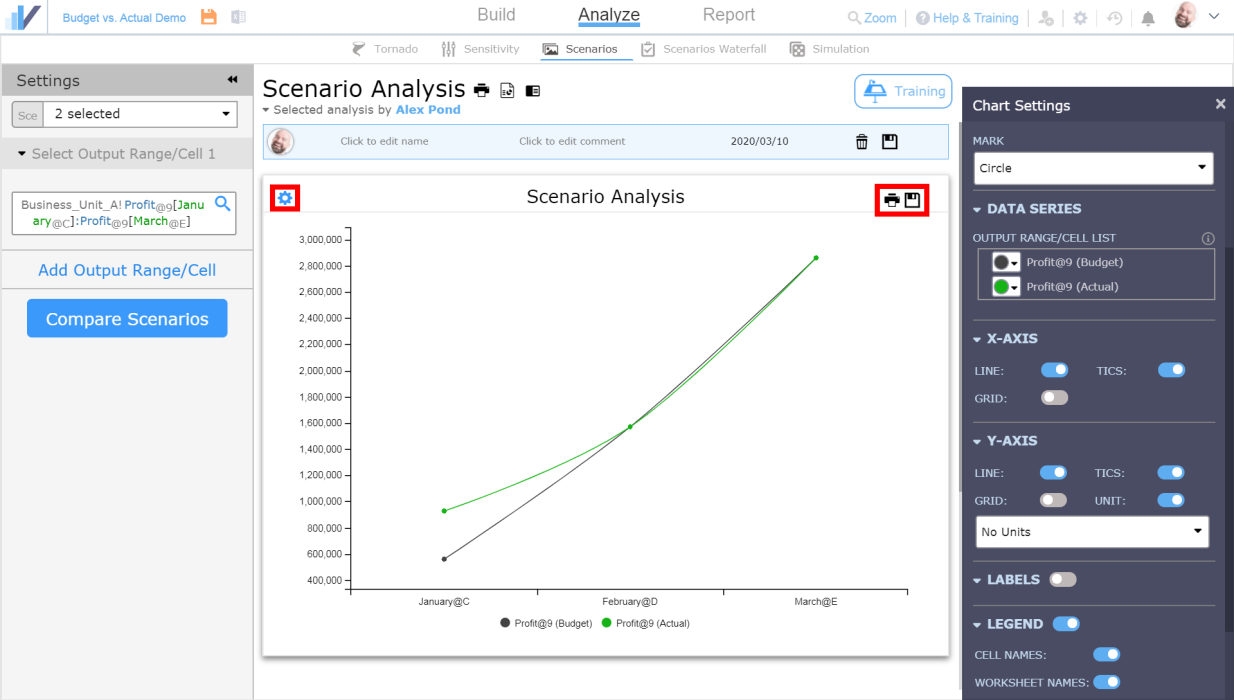
You can select cell ranges and see a time-based comparison (for each period on the x-axis, you will see the value of the cash flow when the selected scenarios are active):
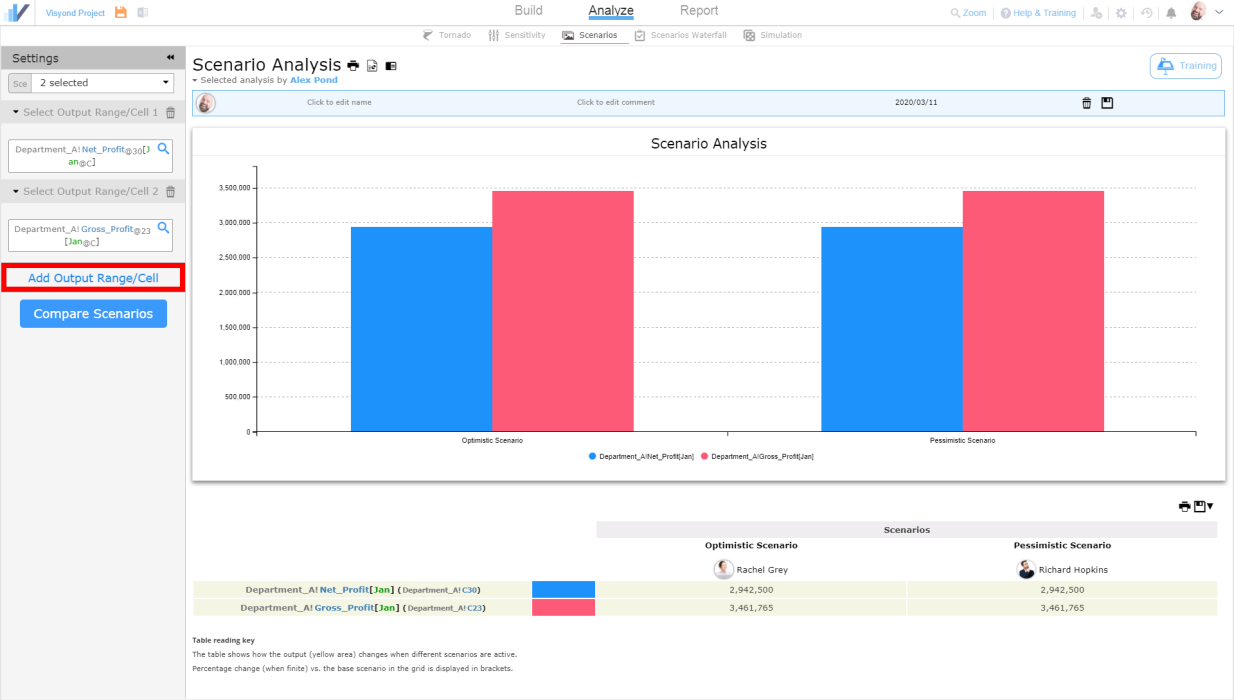
Comparing Individual Formula Cells
You can also select sparse cells individually and, for each scenario (on the x-axis), see the values of those cells when that scenario is active:
Percentage Changes
Below the scenario comparison chart you will find a table displaying the values you see in the chart and their percentage change compared to the scenario that is currently selected in the grid.
Updating the Scenario Comparison Chart and Table
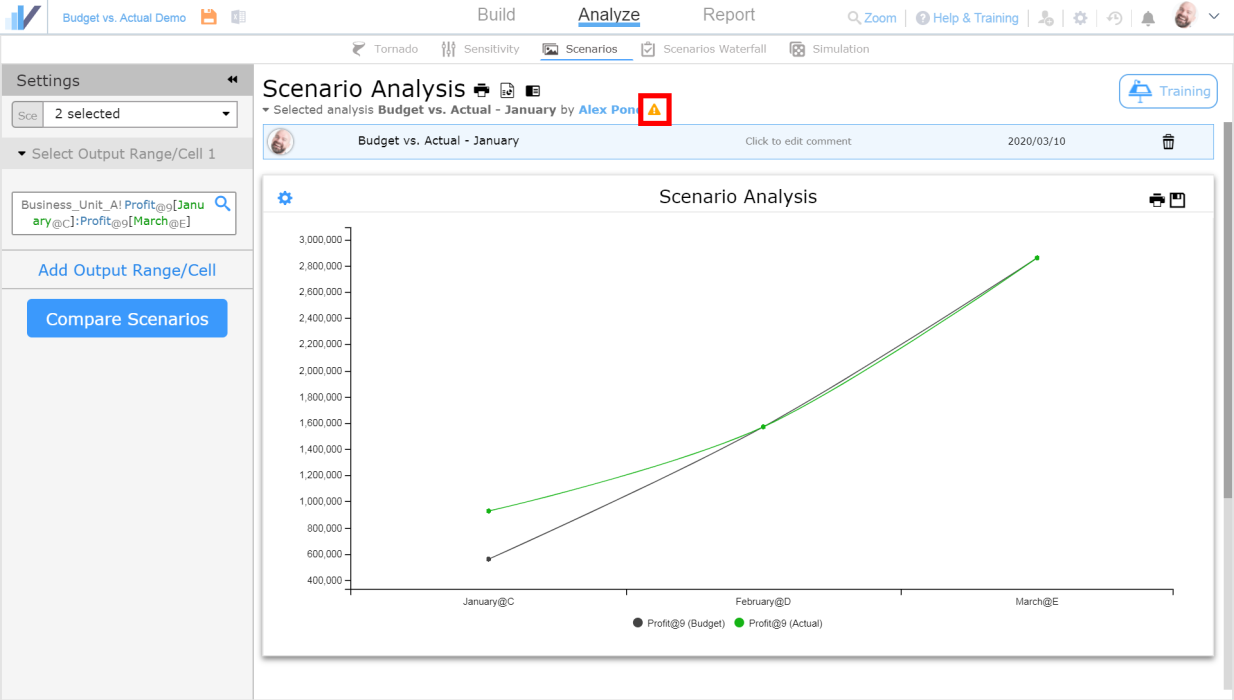
If you’ve updated the scenarios or made other changes to the spreadsheet, when you go back to your scenario comparison charts, you will see that a warning icon appeared next to the analysis that you’ve previously made – this means that there were changes in the spreadsheet since the last time you’ve ran the analysis:
Customizing the Scenario Comparison Chart
You can customize the chart’s appearance by clicking the gear icon on the chart, as well as print the chart (and the comparison table) or save it by clicking the corresponding icons:
See Cells That Make Scenarios Different
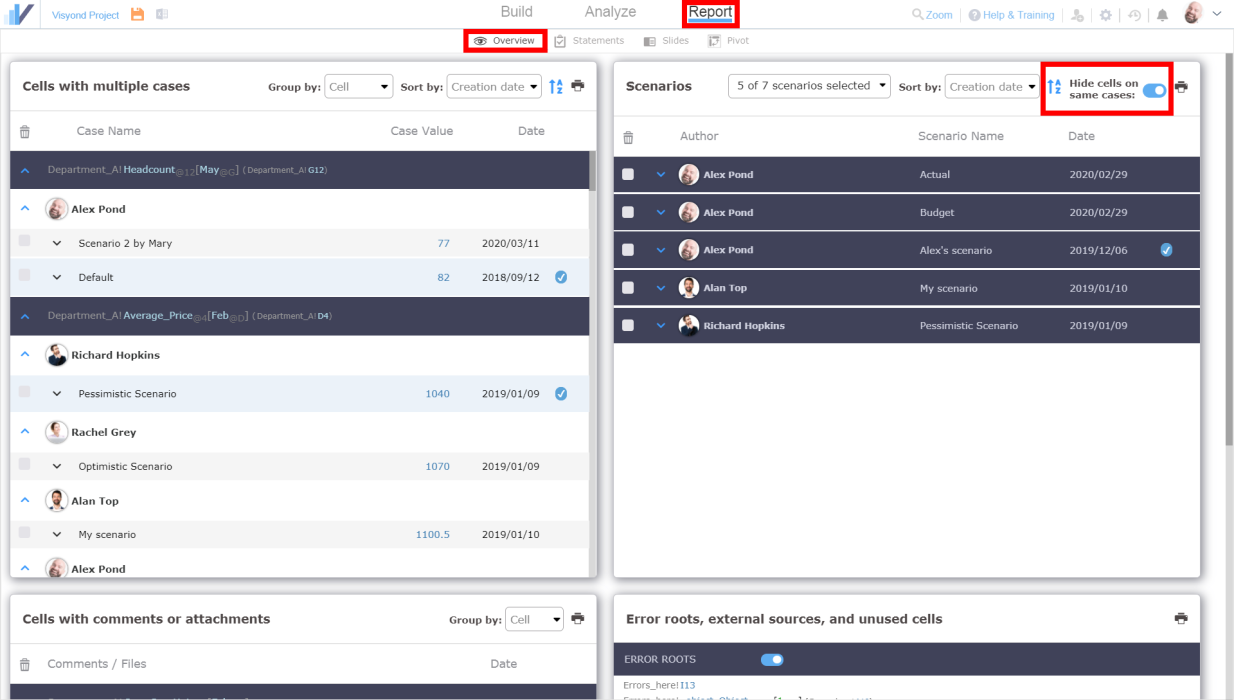
Here you want to see the cells that cause differences among scenarios you want to compare, and hide those that are on the same assumptions.
- Go to the to Overview tab
- In the Scenarios section, select the scenarios you want to compare
- See them with all the cells that are not on their default assumption
- Now switch ON “Hide cells on same cases” and see only the cells that are NOT on the same case in all selected scenarios
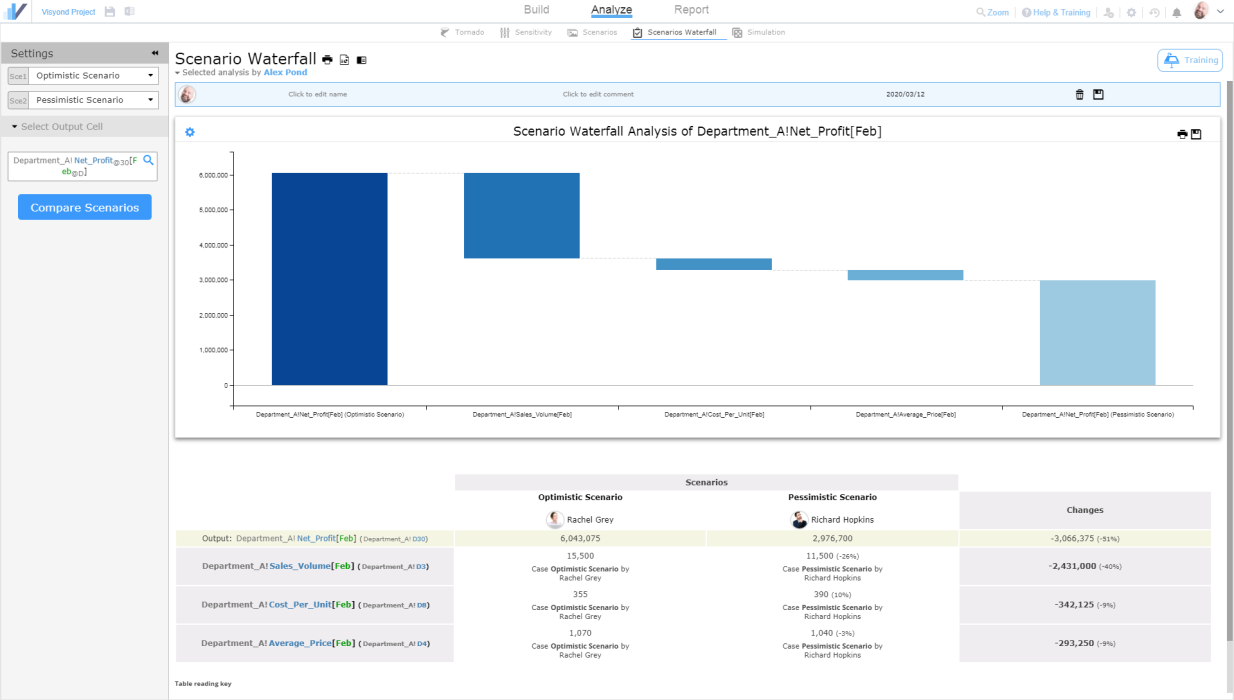
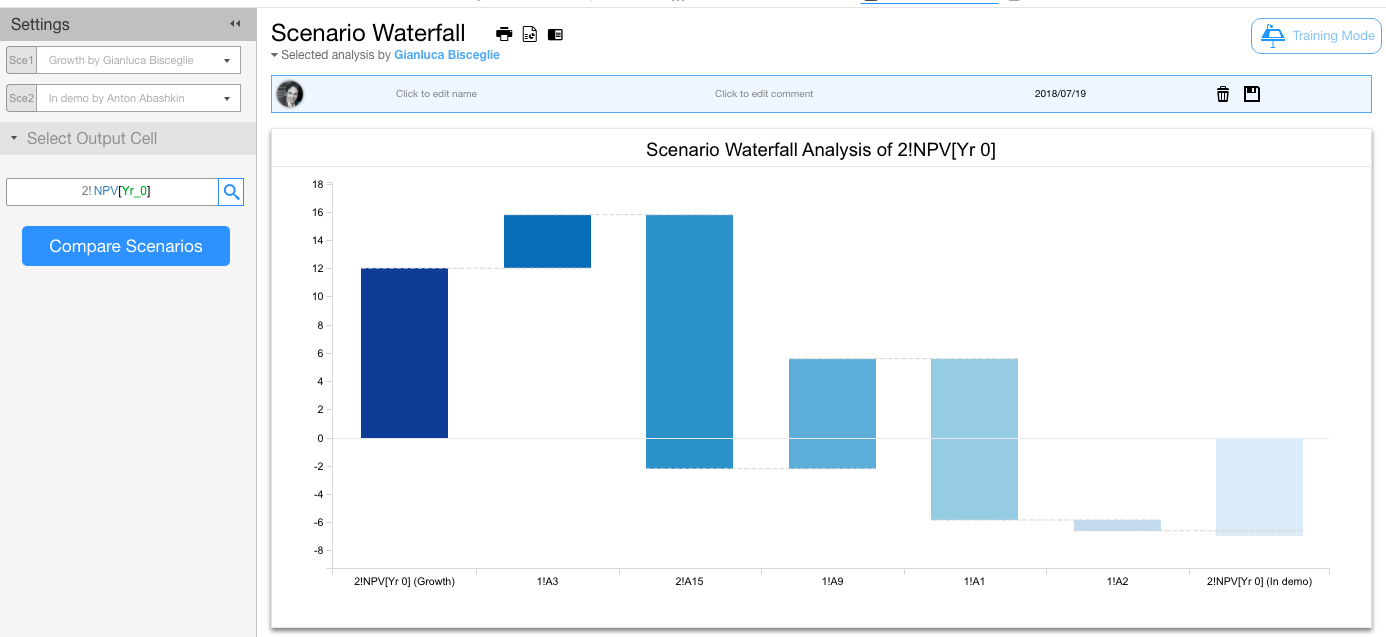
Scenario Waterfall Analysis
Visyond offers an intuitive visual breakdown (in a waterfall chart) of what cells have changed between two scenarios and the contribution of each change to a selected output cell. In the example below, you can see what cells changed (and by how much) to take the Net Profit from its greater value in the Optimistic scenario to the lesser value in the Pessimistic scenario.
Budget vs. Actual
Scenarios can be used to compare and analyze Budget vs. Actual figures. See this article to learn more.
Auto-analysis
Analyze important decision metrics in a few clicks.