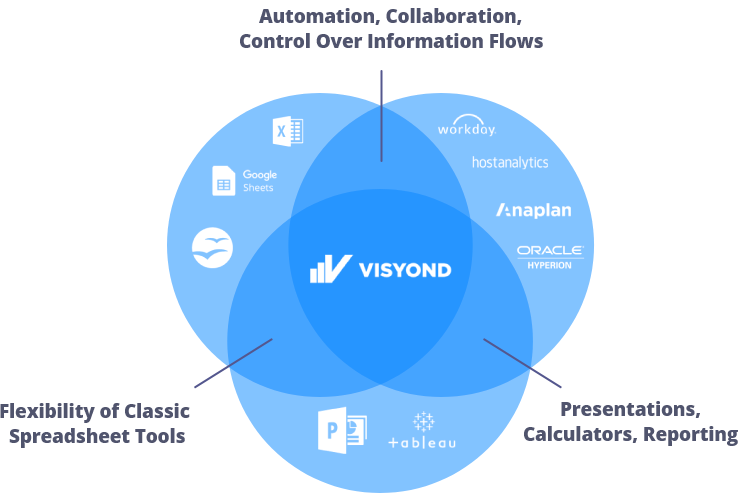
What is Visyond?
Visyond is not just a spreadsheet, a data tracking, governance or a data visualization/dashboarding tool, but a new paradigm connecting spreadsheet models, analyses and presentations in a single source of truth platform.

Problems with Spreadsheet-based Workflow
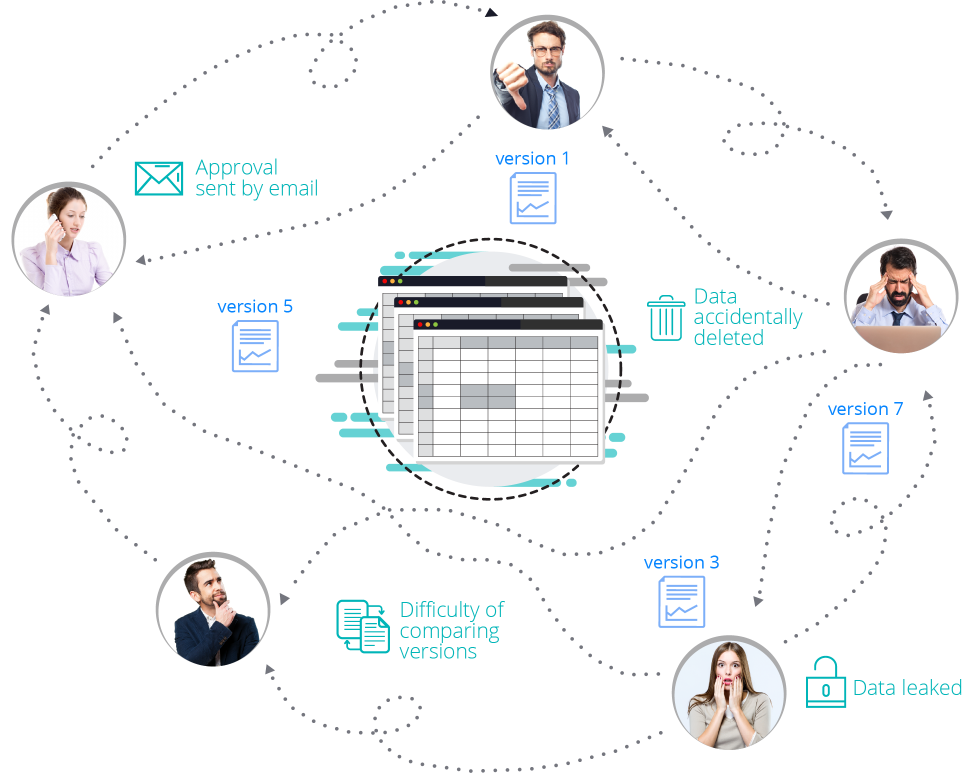
The main problems of any spreadsheet-based workflow are:
- Back-and-forth version chaos when sharing spreadsheets or gathering assumptions: data can get lost, corrupted, or leaked.
- Data attribution and tracking: it’s hard to trace who added what, when and why.
- Data overwriting: both in desktop and online spreadsheets, last input wins, overwriting previous cell values.
- Having a single source of truth: even in online versions, last entries overwrite previous ones, and you have to waste time looking for previous assumptions across versions. A question is always on your mind: ‘Am I sure that the current assumptions, charts, sensitivities are the ones we approved? Can I change something and easily compare to previous scenarios? Can I easily roll back to an approved scenario?’.
- Knowledge management: it’s difficult to locate supporting documents and the conversations leading to certain assumptions.
- ‘What-if’ and stress-testing require special skills or add-ons that are only local to a specific machine, which makes entry-barrier, scalability and maintenance costs high.
- Dashboards require manual and static updates: if you change the spreadsheet, all dashboards and slides connected to it will change. Slides cannot show specific scenarios but only what is currently selected in the spreadsheet. If dashboards allow to change assumptions, they will be changed in the spreadsheet connected to it. So the modeler has to either make dashboards read-only, or allow to test assumptions on local copies of the file to avoid what-if changes becoming permanent by mistake. In online versions, each user interacting with a spreadsheet via dashboards will change the spreadsheet that will become a ‘single source of mess’.
- Shielding sensitive data: if there are certain worksheets or dashboard you want only some people to see, you have to create ‘sanitized’ copies, adding to the version chaos.
- Quickly finding the root-cause of errors.
- Modelers are bottlenecks: they need to edit the model to answer ‘what-if’ questions and update presentations. As discussed above, leaving this to each user of the model will inevitably introduce errors or expose assumptions and scenarios specific only to user A to user B.
How is Visyond different?
Although it’s not appropriate to compare Visyond only to spreadsheets, we will do our best to capture the main similarities and differences in a simple way.
| How is Visyond different? | |
| Installation and accessibility | Visyond is a cloud platform, accessible from any device connected to the internet.
You don’t need to install software on multiple computers, or manage add-ons for every installation. |
| One project, many views | You don’t need to manually manage multiple versions of a spreadsheet when sharing models or gathering assumptions. Each collaborator can have their own view of the environment. |
| Scenario and assumptions | Visyond supports multiple simultaneous assumptions per cell. Recording, comparing and presenting assumption-driven predictive scenarios is a breeze. |
| Charting | Visyond offers easy chart customization, e.g. drag-and-drop data series grouping, also in waterfall charts.
Charts and interactive dashboards are scenario-driven and respond to switching of scenarios. |
| Analysis (Scenarios, Impact, Sensitivities, Simulations) | Without having to install add-ons on every machine, all collaborators and clients, without overwriting others’ work, can quickly run different analyses without technical know-how. |
| Spreadsheet-driven dashboards | Visyond dashboards and slides are live and interactive forward-looking calculators linked to your spreadsheet. This is a safe and interactive presentation layer on top of your spreadsheet, through which stakeholders can play with the numbers without affecting the underlying spreadsheet. |
| Selective sharing | You can decide what worksheets and dashboards / slides each collaborator can view or interact with.
Note: You can ‘hide’ and password-protect worksheets in Excel but it is very easy to circumvent. |
| Project and model status report | All cases, scenarios, comments and attachments are automatically tracked and presented or printed through the Report/Overview module. |
| Formulas | Same syntax for the supported formulas. No support for functions operating on databases, local files, etc.
Consider that even Excel Online is not supporting all the functions or coding practice of Excel desktop (e.g., the Shift + Ctrl + Enter for the Array Formulas). |
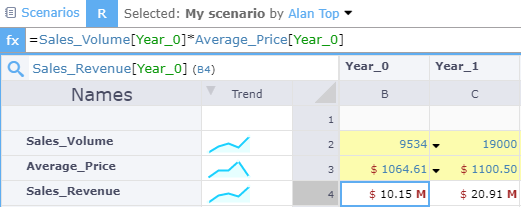
| Natural names | Besides named ranges, Visyond uses its proprietary natural names: any cell is presented with a name composed of its row and column names (e.g. Revenue[2020] instead of A1). |
| Errors and model audit | No need for add-ons. Visyond audit tools are in the cloud and available to all collaborators to quickly identify the root cause of errors, detect anomalies, and navigate between dependent/precedent cells. |
| Cell formatting | Visyond exposes the format menu when you right click on a cell or range. Formatting is visible only when Audit mode is OFF. |
| Big data | Like any other spreadsheet, Visyond is not a Big Data platform.
Visyond runs in a browser. If you want to operate on more than 10,000 rows, 1,000 columns or 128 worksheets, then Visyond might not be what you are looking for. However, you can use totals/aggregated data as assumptions to drive your predictive model. |
| Shortcuts | Working in the browser, not all shortcuts of the desktop spreadsheets can be used. You can import your Excel models into Visyond if shortcuts are very important for you. |
| Conditional formatting | Not supported yet. |
| Macros | Visyond does not support macros yet, but our team can port them to JavaScript, if needed. |
Better Spreadsheet Experience
Visyond looks and feels like a spreadsheet but it is not just another spreadsheet – it is an ecosystem. Visyond eliminates spreadsheet chaos and transforms an environment with multiple versions of a spreadsheet, slides, and analyses – scattered across different tools – into a single source of truth decision making platform by putting your spreadsheet at the center of the ecosystem of scenarios, assumptions, visualizations, analyses, reports and governance, making your spreadsheet the starting point of a collaborative decision-making process.
Visyond uses the same Excel formula syntax you are familiar with so you don’t have to learn a new language or system. If you can build a model in Excel, Google Sheets, Open Office, etc., the same skills will help you build one in Visyond.
The difference is: you will do it faster, with fewer undetected errors, while benefiting from the built-in analysis and presentation automation functionality that connects models, its creators and end-users in a single, secure, collaborative environment.
You can also import your existing Excel models into Visyond so don’t have to rebuild them.
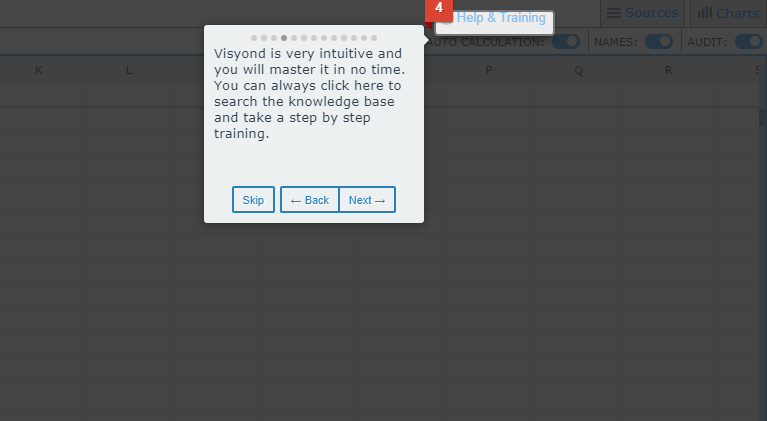
Don’t be afraid to try something new. Most of the actions require literally just a few clicks (e.g. creating a scenario or analyzing it).
At any point, the in-app Training Mode will guide you if you need help, and, of course, you can reference the help portal.
Easy and Visual Scenarios
In minutes, you can record scenarios, visually compare them and prepare an interactive dashboard for colleagues and clients.
- No more long, error-prone and difficult to scale/maintain workarounds using toggles, add-ons, macros, IFs etc.
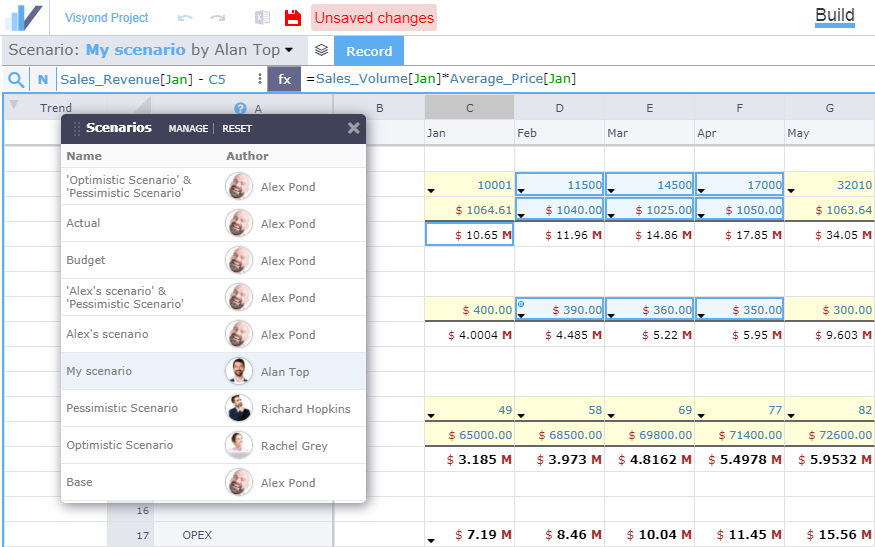
- To improve data tracking, Visyond tells you who created a certain scenario and when. You know exactly which assumptions this scenario contains.
- Everybody can create and manage their own scenarios without overwriting others’ work.
- To improve accountability, nobody can modify others’ data and only the project owner can delete data.
Scenarios and Multiple Assumptions (Cases)
Each cell in Visyond may contain multiple values or formulas (Cases) created by different collaborators, at the same time, without overwriting, and with the ability to seamlessly switch between them. 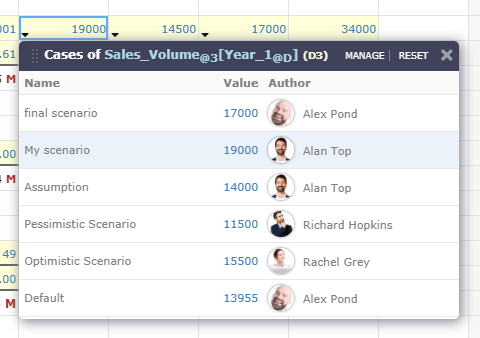
Combined with the easy-to-use scenario creation, management and analysis functionality, this significantly simplifies workflow that usually requires lots of toggles, worksheet or row/column duplication, and IF-type formulas (e.g., Budget vs Actual).
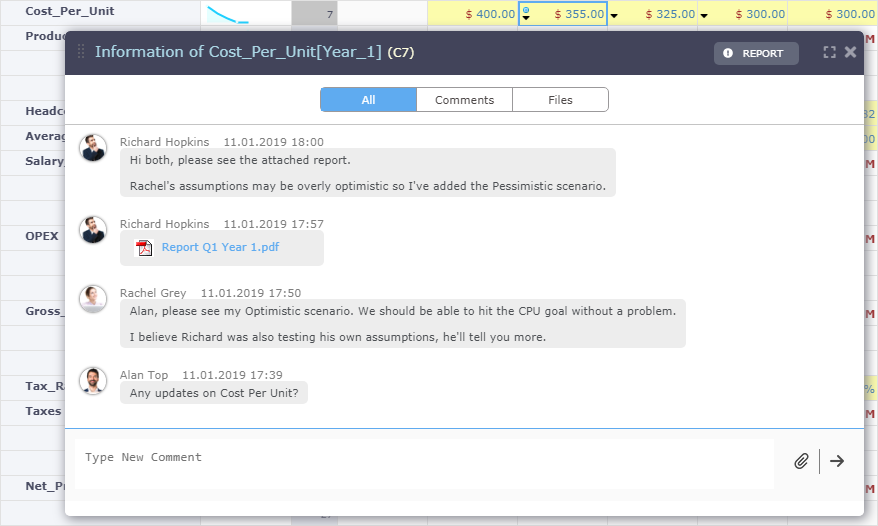
In-cell Chat and Attachments
In addition to multiple simultaneous values, each cell in Visyond can carry multiple collaborators’ comments and attachments.
Single Source of Truth, Data Tracking and No Version Chaos
In Visyond, you do not need to manually manage versions. Instead, each stakeholder can contribute their assumptions or whole scenarios in the same, single place without changing or deleting others’ work.
You can go back in time if you wish, but it’s not necessary to find that value you liked because that value is always available in the latest version for you to select and use in Scenarios and Cases.
You can have stakeholders interact with the spreadsheet and ask their ‘what-if’ questions through interactive, spreadsheet-driven dashboards, without changing or even seeing the spreadsheet.
Visyond provides an always-up-to date project and model status report that shows you all assumptions, scenarios, and attachments added by different collaborators, all unused cells or cells with errors so that you can assess the status of your project at a glance.
Fewer Menus and Autoformatting
Visyond uses fewer top bar menus. Instead, it provides contextual options.
When you are on a cell or range, right click on it and see all the things you can do.
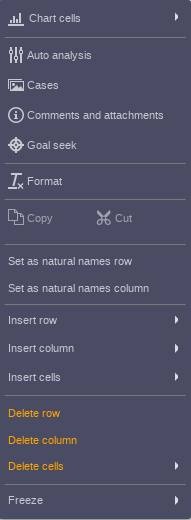
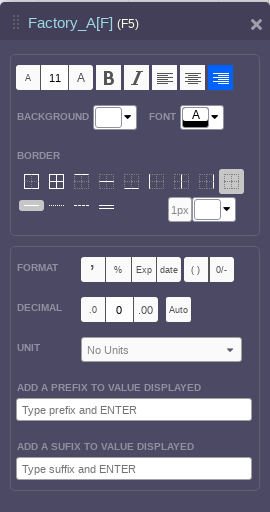
You can switch on the Audit mode (see below) to see cells auto-formatted based on their content, or keep it switched off to add custom formatting as you would do in Excel:
- Right click on the cell, select ‘Format‘
- See all formatting options in the Formatting Panel.
When you click on a chart, the settings panel will open and show all the things you can do on it. No need to guess where to right click on the chart to edit specific parts.
Visyond Modes
Natural Names
Besides named ranges, Visyond supports natural names (e.g. Revenue[2020] instead of A1).
Audit Mode
When Audit mode is ON, cells have background and borders automatically set to give you insights on model structure and data types, errors, and identify anomalies in values based on surrounding cells.
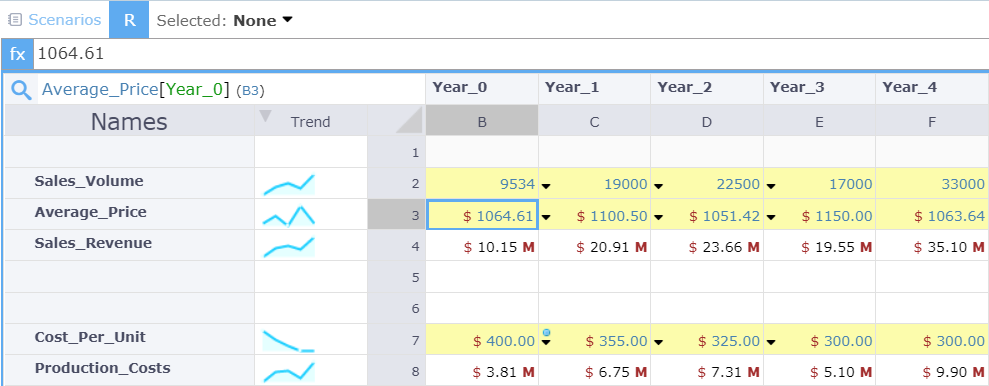
When Audit Mode is active:
- Cells will auto format based on their content.
- Trend-lines will appear.
- Precedent / dependent cells traversing mode will be active.
- Error root cause analysis and anomaly detection will be active.
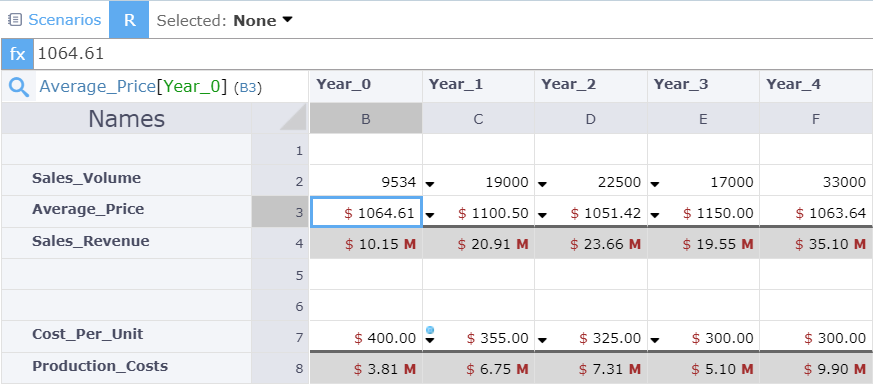
When Audit Mode is OFF, you can format cells as usual.
Analysis: Scenarios,Impact, Sensitivities, Simulations
Once you have built your model, Visyond automates the most popular ‘what-if’ analyses used by decision makers and analysts.
The analysis modules are available to all collaborators who can run their own analyses, based on their own (or others’) assumptions, without overwriting analyses created by other collaborators.
Without having to install external packages or add-ons on every machine, all collaborators and clients, without overwriting others’ work, will be able to:
- Know what are the most important input drivers for a certain output cell with the Tornado Module.
- Run one or two-dimensional Sensitivity analysis in under a minute (you don’t have to setup and format data tables).
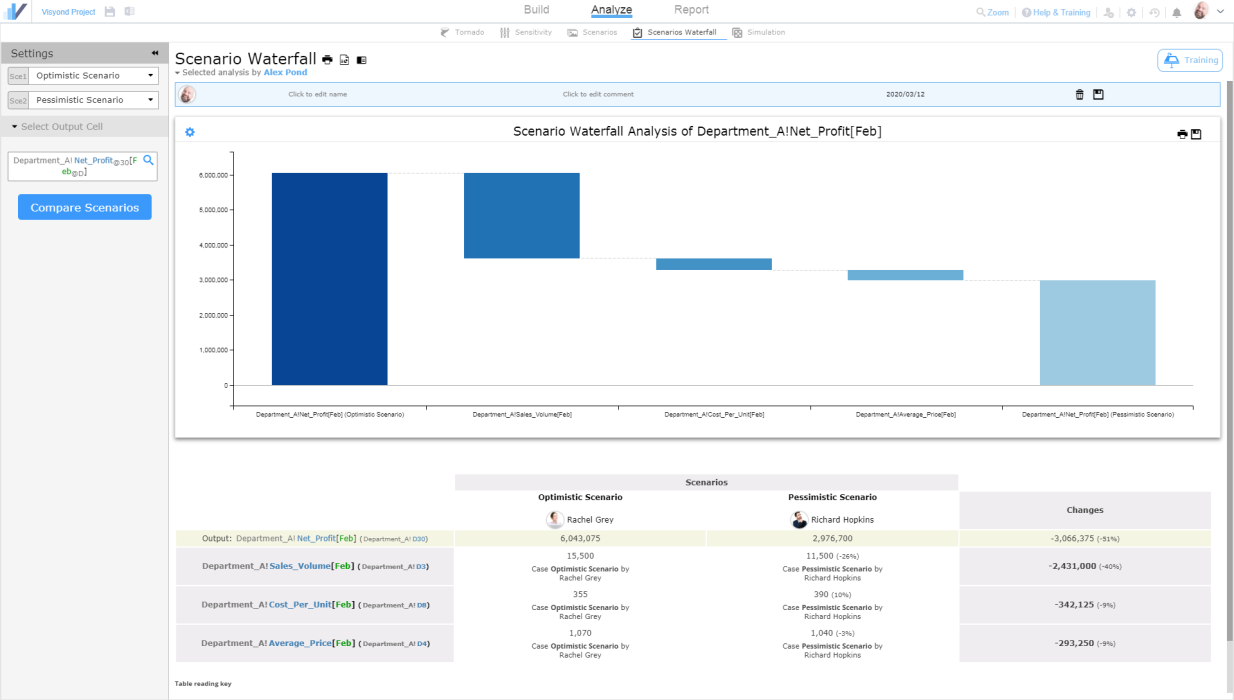
- Compare Scenarios for various output cells, and see a Waterfall chart showing which cells changed and by how much between two scenarios.
- Run Monte Carlo Simulation for risk management.
- Automatically build Financial Statements by selecting periods and items from the spreadsheet.
The pattern is the same for all analysis modules:
- Select cells or ranges.
- Pick your preferred settings (e.g. Sensitivity range (+/- X%) or a type of distribution for Monte Carlo).
- Run the Module and get a nicely formatted chart (you can customize it) that is ready to be exported, printed or visualized in Visyond’s Interactive Slides.
- Every time the model is updated, the changes are presentation-ready: no need to export to other platforms. You just change assumptions, go back to the module and click ‘Run’ again.
Spreadsheet-driven Dashboards and Slides
Visyond Slides are a flexible dashboarding system that can be presented, or securely shared with collaborators or via a public link.
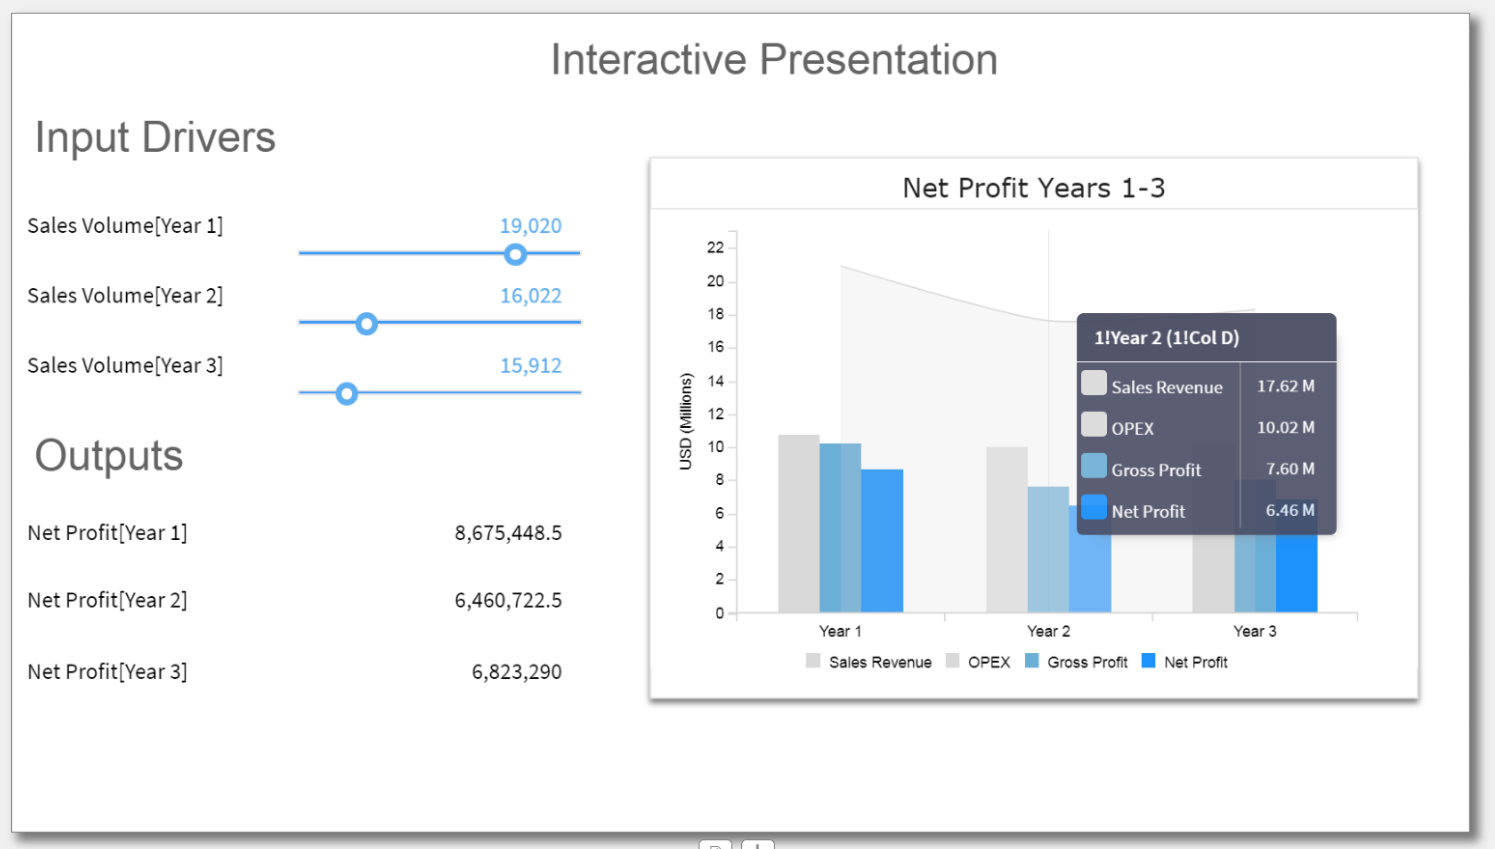
This is a safe and interactive presentation layer on top of your spreadsheet, through which stakeholders can play with the numbers without affecting the underlying spreadsheet.
- You can have multiple slides and share them independently with different collaborators (for example, the CEO will only see slide A and B, the CMO only slide B, a client only slide C, etc.).
- Each slide can contain text, input/output cells and charts from the spreadsheet (from the grid or from the what-if modules).
- Output and input cells are driven by the same formulas you use in the spreadsheet. When you change numbers in the dashboard you will see the linked cells and charts change, but the spreadsheet itself will remain unchanged. What happens on a slide – stays on that slide.
- Input cells can be styled as sliders or dropdowns.
- Each slide can be set to follow a specific scenario you’ve created in the spreadsheet. The key input cells you expose on a slide (Tornado analysis will tell you what cells have the highest impact on certain KPIs) will update the output cells and charts only on the slide where they are. At any point you can reset the input cells on a slide to their spreadsheet values.
- Slides can be shared with clients and decision makers to empower them. They can self-serve and test their own assumptions without waiting for the modeler or analysts to manually change values and prepare a new presentation.
Selective and Granular Sharing
You can decide what worksheets and dashboards / slides each collaborator can view or interact with. For example, you can share only a worksheet for entering assumptions while the calculation sheets will not be accessible.
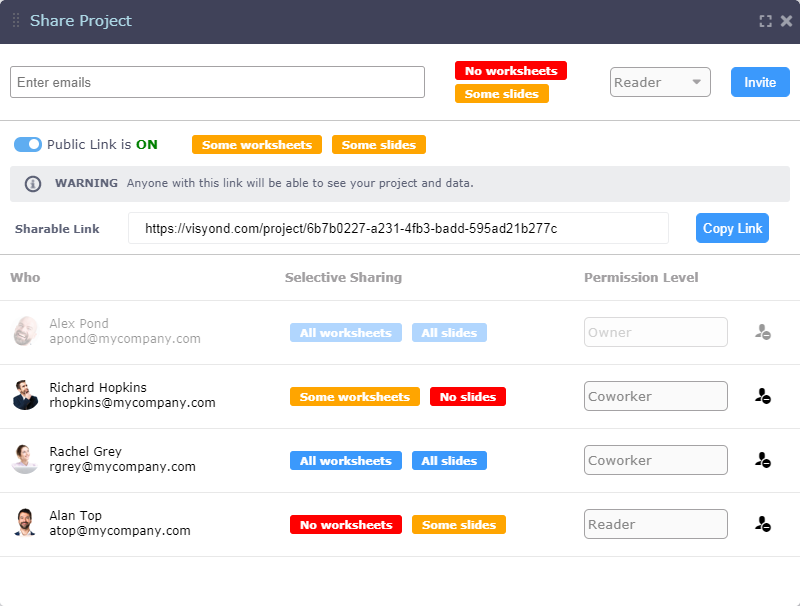
Note: You can ‘hide’ and password-protect worksheets in Excel but it is very easy to circumvent.