Generate always up-to-date, forward-looking financial statements from your spreadsheet. Just select relevant rows and columns, and Visyond will do the rest.
You will generate, without long and error-prone manual setups, the following:
- Income Statement (aka Profit and Loss Account)
- Balance Sheet
- Cash Flow Statement
- Ratios
Visyond creates forward looking predictive statements, driven by assumptions in an operating model. For simple, backward-looking statements, any accounting tool is probably enough. For spreadsheet-driven pro-forma statements, Visyond will dramatically simplify the process.
A Note on Accounting Standards
Financial statements typically follow standards defined by a specific nation.
Accounting standards prescribe in detail what accruals must be made, how the financial statements are to be presented, and what additional disclosures are required.
Visyond’s statements can adapt to any standard and automate the preparation of statements based on your settings. You just have to follow your standards and add items to macro categories (i.e., Revenues, COGS, OPEX, CAPEX, etc.) accordingly.
For example, based on your accounting standard, among other things you will decide:
- What items (rows) and periods (columns) to select from the operating model for each category (Visyond settings will guide you)
- The level of granularity you have to show (e.g., revenues by geography vs aggregated)
- The management accounting KPIs and ratios you have to show
- What assets are tangible or intangible
- What expenses are CAPEX or OPEX
- What depreciation / amortization parameters to use for certain items (just set useful life, residual value, and whether the asset is tangible or intangible for the proper reporting on the balance sheet)
- If you require external funding, you can set a target debt to equity ratio
Automated Financial Statements
When it comes to translating your business model into financial statements for banks, investors, analysts and decision makers, you need a solution that not only can look at the static data from an accounting system, but that can also show you how the future of those statements look like given certain assumptions and scenarios.
Although many firms use spreadsheets, they are cumbersome. Using them often implies building formulas in intermediate worksheets, using “plugs” or circularities to balance the statements. This opens the door to errors, requiring extra time to audit the results.
Imagine the impact of miscategorizing CAPEX and OPEX: it would require rework, especially to recalculate depreciation and amortization. Visyond converts your spreadsheet model into up to date pro forma financial statements in a few clicks.
Getting Started
Before you proceed to make a financial statement, you have to prepare the spreadsheet model that will drive them. You can import you Excel file with data or create a new project from scratch.
Preparing the Spreadsheet with Input Data
Let’s start by preparing a simple template.
Type the names of drivers in the name column and the periods in the name row.
Each driver (e.g., Revenues, Costs, Assets, etc.) in the spreadsheet should contain values in each period (e.g., 2020, 2021, 2022) that will be used by the Statements module.
You do not need to calculate depreciation/amortization or ratios: these are part of the module’s work.
Adding and Removing Drivers from the Statements
Switch to the TAB Report/Statements to see an empty set of financial statements.
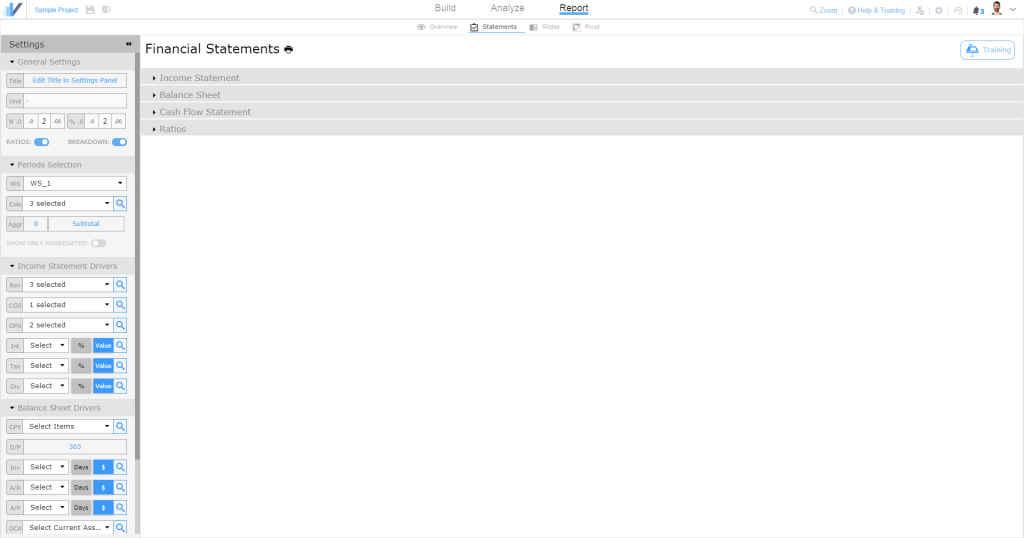
Select periods
We can now simply follow the menu on the left. For example, let’s select the periods we want to see in the statements, say all of them: 2018, 2019 and 2020. See how the statements start to update.
Selecting drivers (e.g. Revenues, COGS, etc.) and Consolidation
You can use the magnifying lens, like in other modules, to pick up the rows containing the drivers.
You can pick rows from multiple worksheets but their columns must match: if column D is 2021 in one worksheet, it must be 2021 in all the others that are used.
Now we add the revenues and immediately see how they are placed in the Income Statement and how the ratios update.
Try for example to go back to the periods you set at the previous step and unselect 2019: see how the growth updates. You see how much time you save every time you will add or remove anything from the statements with just a click, without having to insert rows, columns and update formulas in the spreadsheet.
Categorizing OPEX and CAPEX
Let’s move now to the cost section. In our example we do not have COGS but we have 2 OPEX items and 1 CAPEX item.
Let’s select them and see how the statements change.
Depreciation Schedule Made Easy
Have you built a depreciation schedule in Excel that looks like this?
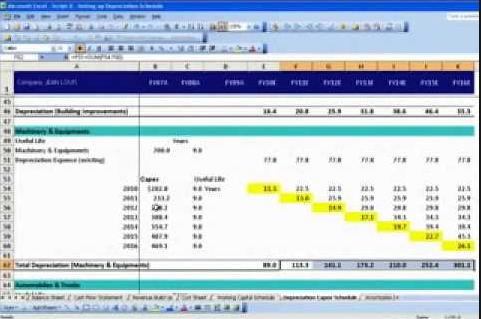
Nothing like that in Visyond: for each CAPEX you will see a depreciation table where you will write useful life, scrap value and whether a CAPEX is a tangible or intangible asset. Based on your data, you will see the depreciation line change on the income statement and the balance sheet.
Required Cash and Debt to Equity (or Debt to Value) ratio
Visyond statements are not only a snapshot of the present, but a forecasting tool too.
If your model does not generate enough cash, you will need external funds.
In the Funding Drivers section, you will be able to set:
- The minimum cash you require (you can either pick a row in the spreadsheet where you have somehow determined this amount in each period, or directly enter comma separated values like in the example below).
- The target capital structure: Debt to Equity ratio (D/E) or Debt to Value (D/V) ratio
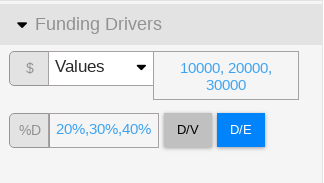
Visyond will show you the debt and equity to raise to maintain that cash balance. If you don’t specify a minimum cash, Visyond will assume you are fine to use all your cash and end up each period requiring external funds with zero cash (the profitable periods will obviously generate cash).
The target D/E and D/V ratios cannot be matched when the business is profitable as the debt is repaid and the ratios go down. If you would like to get closer to the target also when you generate cash, set the minimum cash required to a level beyond what the business generates organically. This will require external funds and boost the D/E D/V ratios.
Ratios
After the cash flow statement you will find the most common ratios. Please get in touch if you would like us to add more.