Make your spreadsheets error-proof. Get a bird’s-eye view of spreadsheet structure, detect root causes of errors and anomalies.
If you would like to audit an Excel spreadsheet, see how to import your Excel file into Visyond.
Audit Mode
What Audit Mode Does?
When in Audit Mode, Visyond will automatically:
- Detect the very first error cells that cause all the other errors in your spreadsheet
- Detect cells that have pattern anomalies compared to their adjacent cells, indicating a potential human error
- Show you the type of cells so you can spot architectural glitches
- Help you maintain consistent formatting of data
- Provide better readability of your spreadsheet
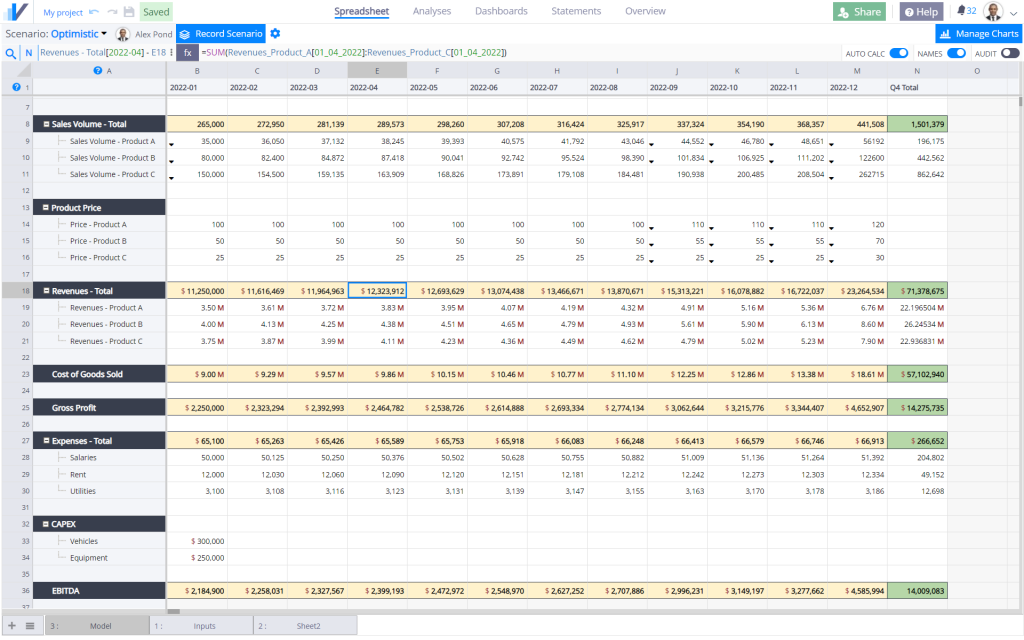
Audit Mode is turned on by default when you create a new project. If you are importing from Excel, it is turned off so you can see the same formatting you had in your Excel file.
Turn Audit Mode On
To activate Audit Mode, click the Audit switch in the top right corner:
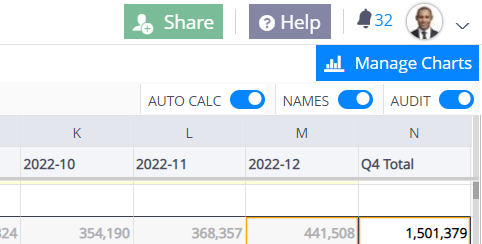
We recommend that you keep the Audit Mode on to get a bird’s eye view of the model structure, row trends and potential errors.
Identifying Errors
When in Audit Mode, Visyond offers a simple way to identify errors and their root cause:
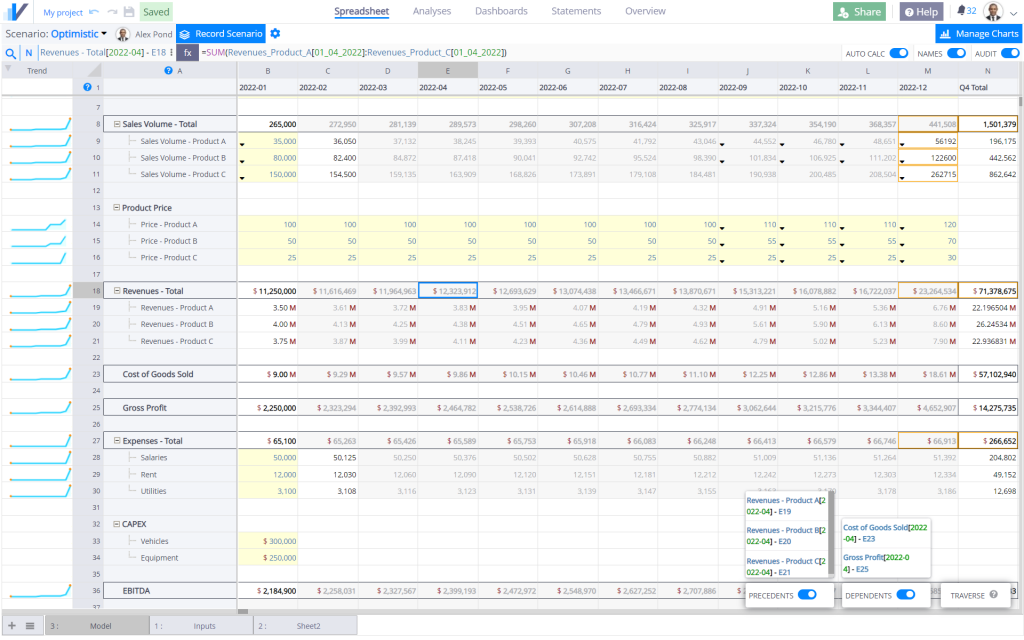
- It highlights errors and cells with circular references.
- Trend lines help you visually identify unexpected spikes in values.
- Precedents Panel displays the precedent cells that are causing the error in the currently selected cell.
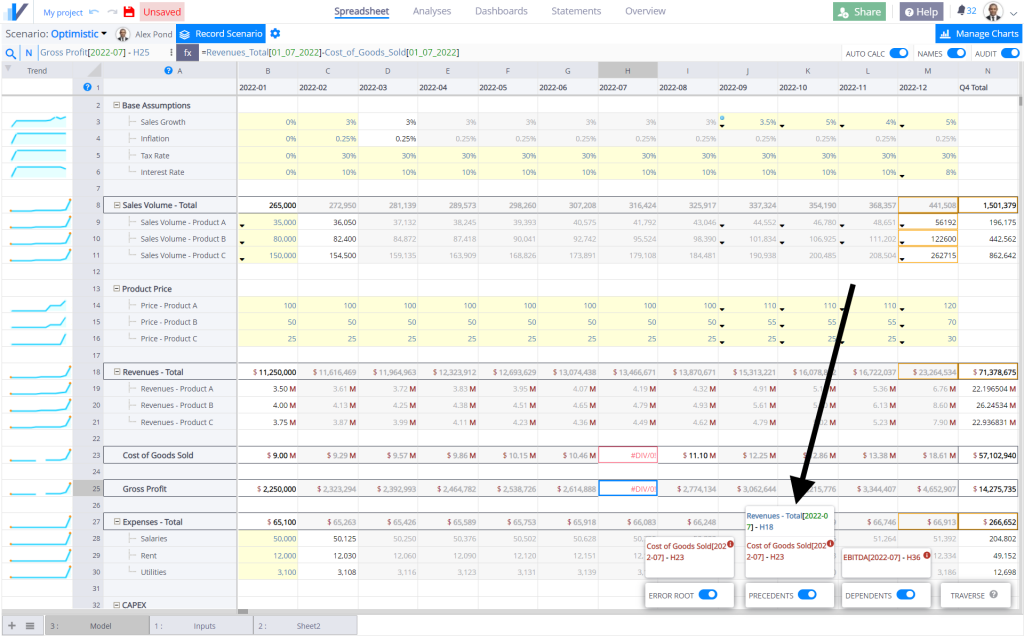
- Error Root shows the root cause of the error propagation chain (the very first cell that causes the error in the current cell) .
Navigating Precedents and Dependents
You can navigate between precedent and dependent cells and check them for errors until you locate the first cell causing error propagation – the root cause of error:

Find the Root Cause of Error
If you have a large spreadsheet with many worksheets it can be difficult to track the root cause of errors by navigating through the precedent cells.
Instead, Visyond offers a convenient way to locate the cell containing Error Root.
In the example below, we know that the selected cell returns an error because its precedent cell H25 (Gross Profit[2022-07]) also returns an error caused by cell H23 (Cost of Goods Sold[2022-07]) – the error root cause of the recalculation chain.
So there is no need to check all precedents – you can go directly to the root and fix the error there. This will fix all errors in the recalculation chain.

List of All Errors in the Spreadsheet
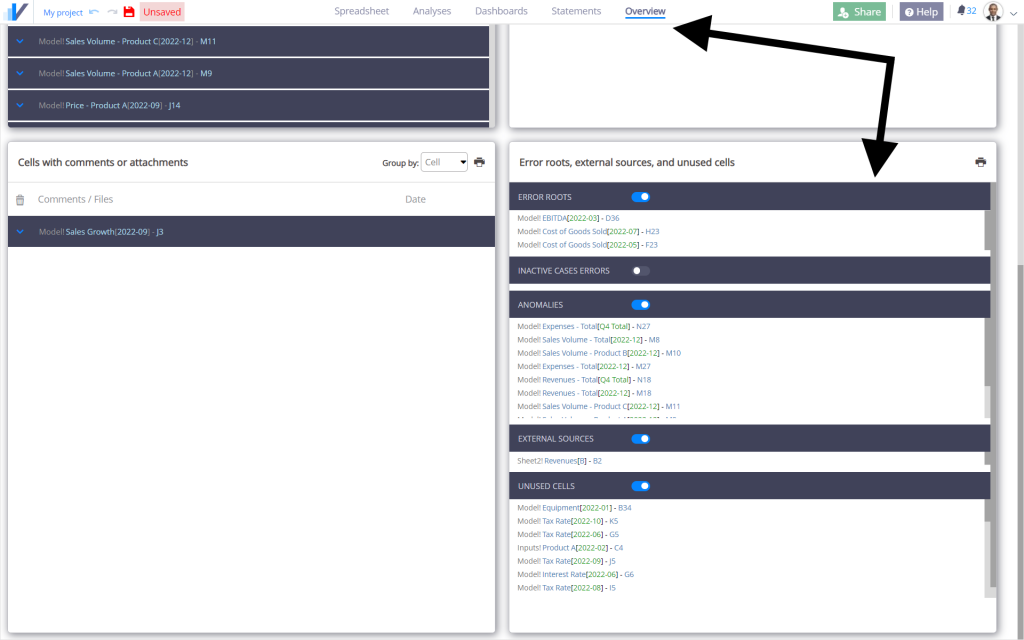
If there are multiple cells that initiate error propagation, you can see them all on the Overview tab.
You can click on them to find them in the spreadsheet. In this report you will also see any unused cells, cells that contain formulas with external sources and anomalies.
Find Data Anomalies
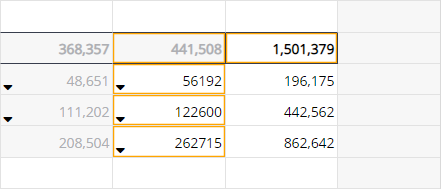
Cells with orange border indicate potential anomalies based on the type and formula patterns of adjacent cells.
Inspect the Anomaly
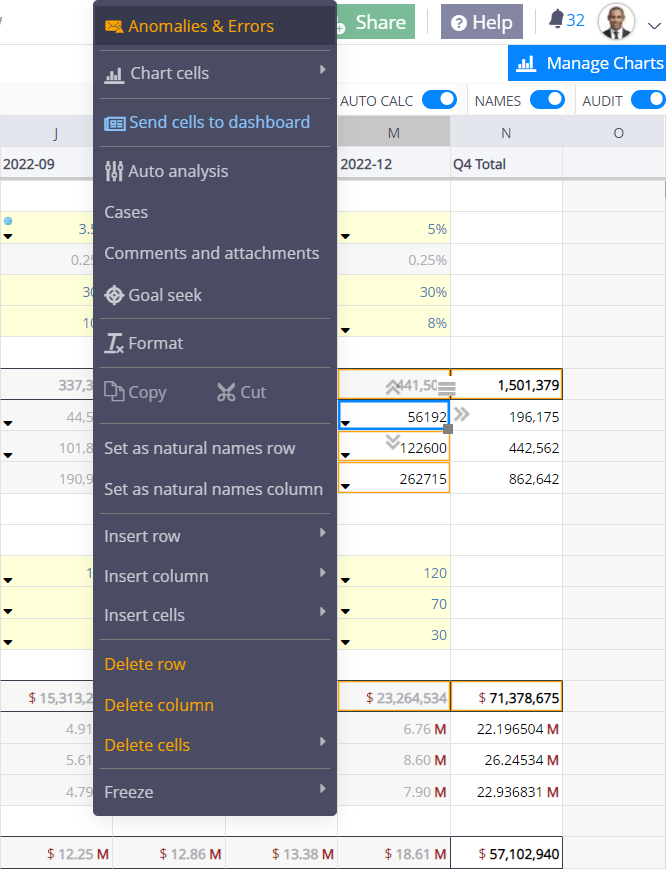
To find out more about the anomaly, right click on the cell and select Anomalies & Errors:
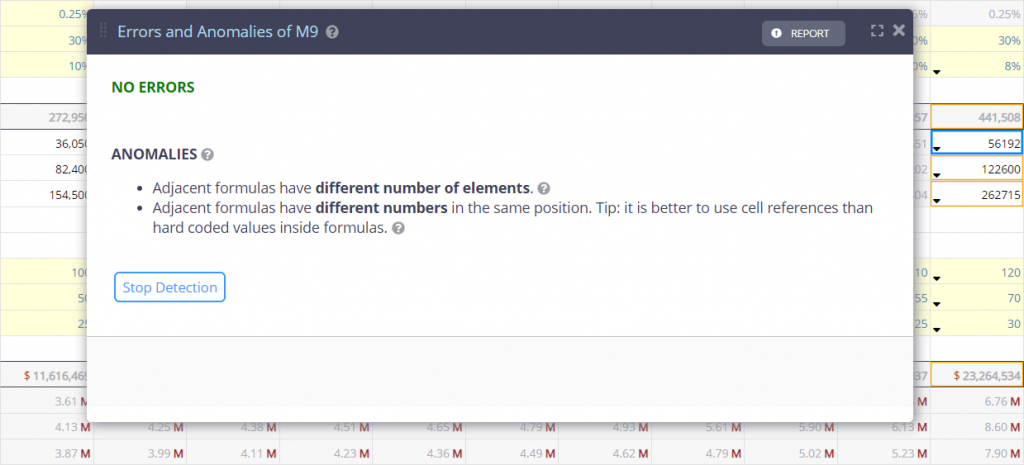
This will open the Errors and Anomalies panel that will display information about the selected cell:
Which Anomalies Can Be Detected?
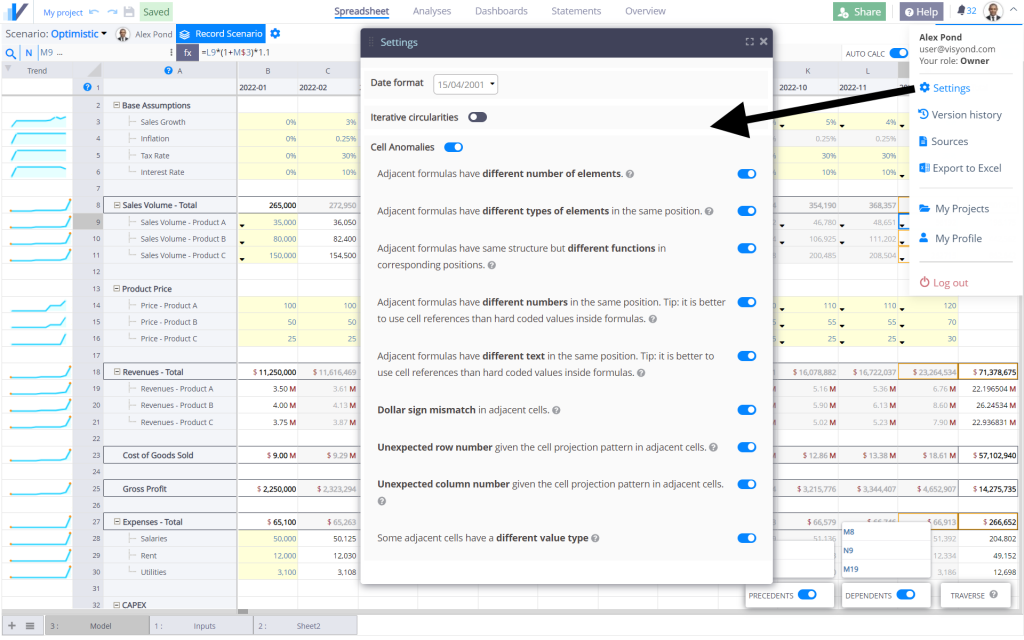
Adjacent formulas have different number of elements:
=3 + SUM() vs =3 + SUM() + 5
Adjacent formulas have different types of elements in the same position:
=3 + SUM() vs =ABS() + 5
Adjacent formulas have same structure but different functions in corresponding positions:
=3 + SUM() vs =3 + ABS()
Adjacent formulas have different numbers in the same position:
=3 + SUM() vs =5 + SUM()
Adjacent formulas have different text in the same position:
=CONCAT(‘Revenues’, B3) vs CONCAT(‘Rev’, B3)
Dollar sign mismatch in adjacent cells:
B1 = $A1 vs C1 = A$1
Unexpected row number given the cell projection pattern in adjacent cells:
B1 = A$1 vs B2 = A$2
With the dollar sign on the row number we do not expect A$1 to become A$2
Unexpected column number given the cell projection pattern in adjacent cells:
e.g., B1 = $A1 vs C1 = $B1 :
With the dollar sign on the column number we do not expect $A1 to become $B1
Some adjacent cells have a different value type:
A1 = ‘Revenues’ vs B1 = 5
Formula vs non-formula discontinuity:
A1 = ‘Revenues’ vs B1 = NPV()
Anomaly Detection Settings
You can switch anomaly detection on/off and enable/disable detection of different pattern variations from the Settings panel.
Auto-formatting
It is useful to color-code cells to be able to assess spreadsheet structure at a glance.
Professional modelers format at least input cells in a different way.
Visyond helps you understand whether a cell contains a number, a string, a date or a formula by auto-formatting them when Audit Mode is on, and automatically changes these formats based on the cell content.
A client once complained that after importing an Excel file in Visyond, many cells were marked as errors. The reason was that after passing so many hands, someone deleted a worksheet, invalidating the references to many formulas. With Visyond, you can immediately uncover these kinds of issues.
Original Formatting Is Preserved
Auto-formatting does not overwrite the original formatting (when Audit Mode is off).
Color coding
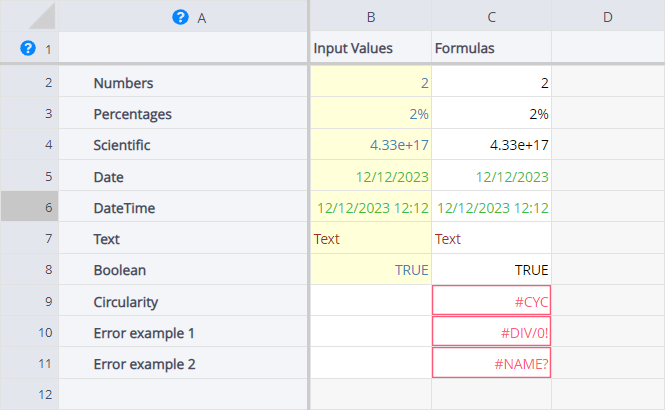
In Audit Mode, each cell looks different based on the type of data it contains.
White cells contain formulas:

Grey cells contain projected formulas:
You can focus on the left-most white cell and be sure the grey ranges contain the same formula with shifted references. So, if you are happy with the formula in the white cells, you don’t need to audit the grey ranges.

Yellow cells contain hardcoded values. Font color is used to distinguish between different types of data:
- Blue: Numbers or percentages
- Green: Dates
- Dark-red: Strings
Cells with red borders and fonts indicate wrong or incomplete formulas or other function-specific errors.
Trend lines
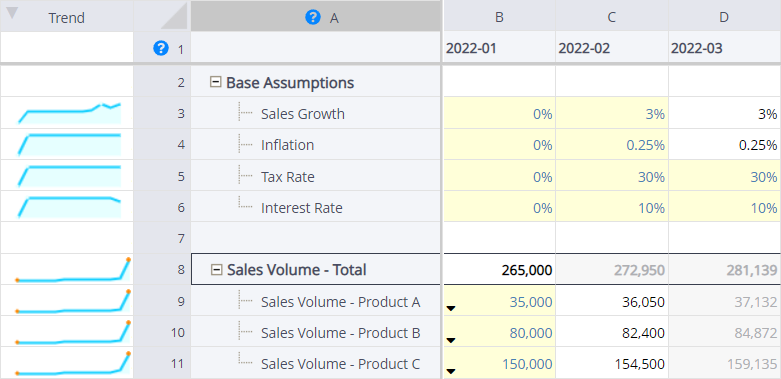
When in Audit Mode, Visyond automatically creates trend lines to visualize whether there are any unexpected spikes on that row. This way, you don’t have to inspect numbers one by one or chart them to identify inconsistencies.
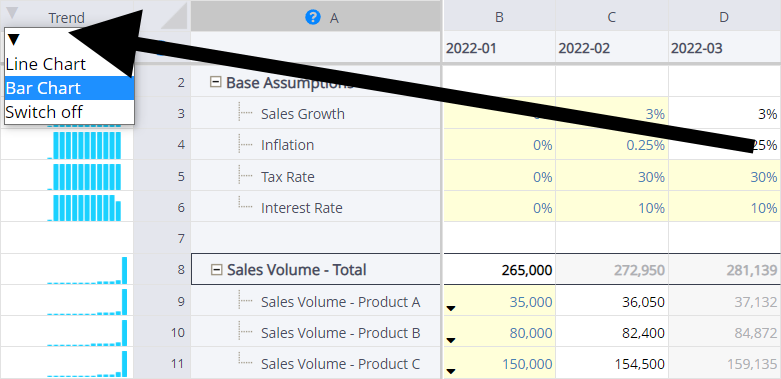
To switch between different types of trend visualizations, click on the arrow:
Natural Formula Names
Make your models easier to understand and debug with natural language formulas.
