New to Visyond? A visual overview

Welcome to Visyond.

We have designed Visyond to take the hassle out of most spreadsheet modeling tasks, save you time, and reduce the probability to introduce accidental errors. We also hope Visyond will transform what used to be a tedious job into an engaging and fun activity.

With Visyond you will be able to build models and carry out, in seconds, analyses that only consultants and skilled modelers could do with traditional spreadsheets and expensive tools. You will do this in a fraction of the time and without worrying about deleting or changing your collaborators’ input.

You can slice and dice data and track who added assumptions or attached supporting document inside the cell, when and why.

You will collaborate with your colleagues and consolidate data without the madness of going through email threads and attachments.

collaborators
Collaborators who created scenarios

You can create gorgeous printable charts at the click of a button.

All this can be done on any device with a browser and a fast internet connection.

What if I am used to other tools?

For those of you who have add extensive training on other spreadsheet platforms (e.g., Excel), it may take you some time to get acquainted with the new functionalities but the payoff will be huge, as reported by our clients.

Besides, the management team comes from decades of hard work on Excel and other analytics platforms, and are on a mission to constantly improve user experience and productivity of fellow professionals.

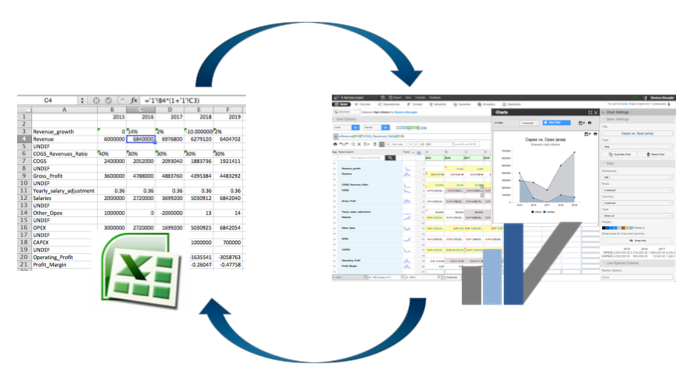
We tried our best to offer full import / export capabilities so that you can start exploring Visyond by importing existing Excel models.

You can start from scratch in Visyond or import from Excel

Tips for better performance

Visyond runs in the browser: install the latest version of your browser for the best user experience.

Also, close unneeded applications, tabs and browser windows to free up memory.

Creating an account

Sign up is free and you can either use LinkedIn and other social networks, or fill up a form.

The Project Dashboard

Once you have signed in, you will land on your project dashboard, which has been preloaded with a Sample Project.

As you can see, you can either create a new project or import an Excel file.

Visyond dashboard
Your first Visyond dashboard view

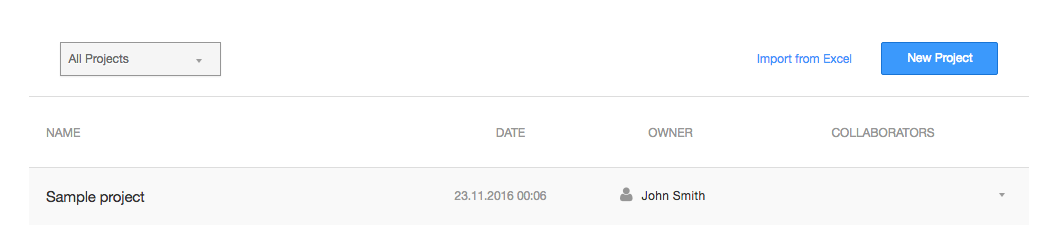
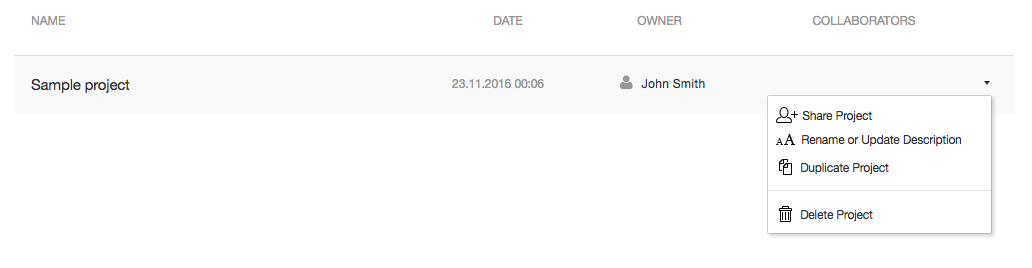
Clicking on the dropdown menu of each project you can:

  • Share it with your colleagues
  • Rename it or Update its description
  • Duplicate it
  • Delete it
Actions on a project


Sharing your project and changing permissions

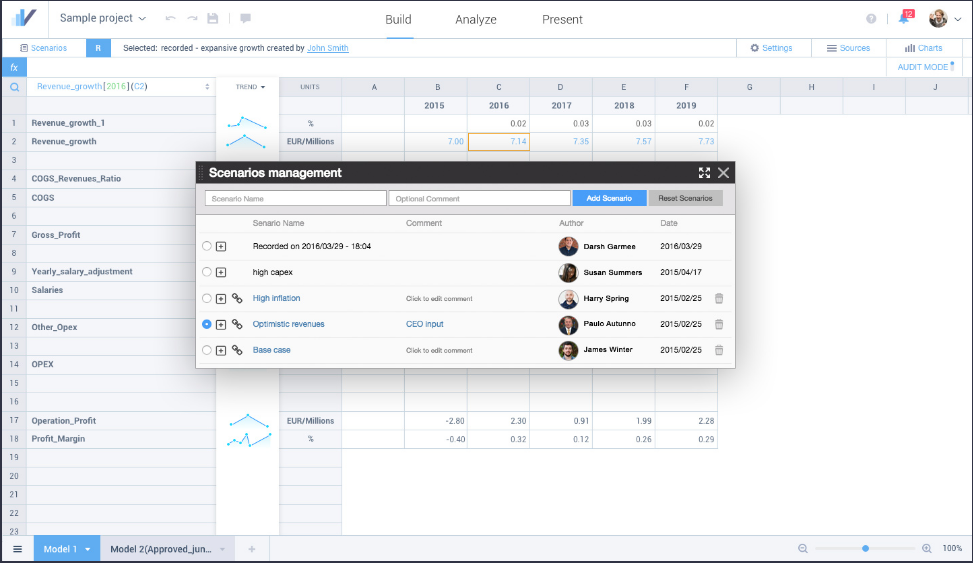
You can share your projects so you do not have to manually consolidate or switch assumptions.

Unlike other solutions, Visyond stores ALL your collaborators input over time and allows you to select any of them with a click.

To invite your collaborators, click on Share Project in the project dropdown menu and type their name or email.

Share project and change permissions

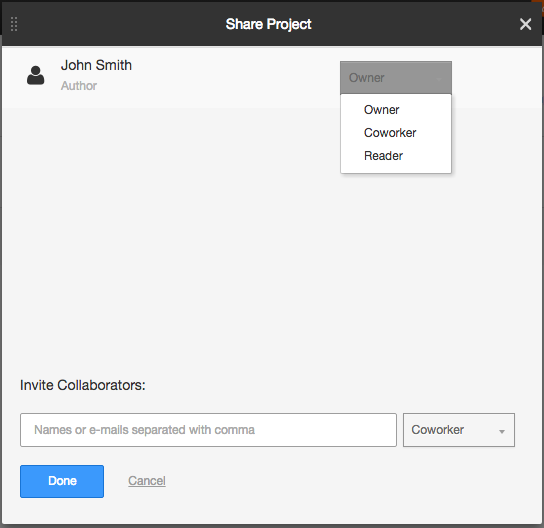
If you invite a collaborator as Coworker, she can edit data on the shared spreadsheet.

Please note that nobody, including the owner, can delete or modify data inserted by others: Visyond protects data integrity and accountability.

From the Share Project panel, you can change the permissions of each collaborator or transfer your ownership to someone else.

Duplicating the project

When you duplicate a project, all the input from your collaborators will be kept, but they will not be collaborators in the duplicated project. You will have to share the project with them if you want them as collaborators also in the duplicated one.

Let’s look at the project environment. Click on the preloaded Sample Project.


The Help Menu

At the top, you will find a comprehensive Help menu that will take care of any need:

  • Do you need to explore the main page elements on any tab? Click on HINTS
  • Do you need to see a step by step intro to the page? Click on INTRO
  • Do you need to watch video tutorials? Click on TUTORIALS
  • Do you need further help or leave feedback and ideas to improve the product? Click on HELPDESK
Help Menu
Help Menu

Use the Intro at the top to get a interactive demo of the various features of Visyond. The Intro will show you feature/tab specific information.

For example if you are on the Model tab this is what you will see when you click on the Intro.

3. intro tab-model


However if you are on the Dependencies tab this is what you will see if you click on Intro


Intro tab dependencies


In addition to the interactive Intro you can also activate the “hints” from the help menu and then hover on the relevant elements.

Hints
Hints


Collaborators

On the top right of your screen, you can see and manage collaborators and permissions.


project status


Under the top bar, you will see the TABs to BUILD, ANALYSE and PRESENT your model.

The Model tab is where you start building your model or interacting with an imported one.

The others deal with advanced analytics and reporting features of Visyond. Explore them to get a sense of what Visyond allows you to do with a few clicks.


2. Overview of the top tab bar


Natural names

Unlike other spreadsheet software which use only cell references like C21, in Visyond you can use natural names like Revenue_growth[2016] as you create a formula. This makes the model extremely easy to understand and audit.

Trendlines

Trendlines are extremely valuable for catching errors when your spreadsheet has hundreds of rows and columns. For instance if the trendline for salaries in 2016 show a dip compared to 2015 while you know for a fact that salaries have increased you have a problem.

Trendlines

Charts

Visyond has extensive data visualization capabilities. With Visyond you can create charts and tables, and present them to your colleagues or clients from inside the software instead of using a separate presentation tool.


Here’s how you view and use Charts .


10. Charts


Settings
Here you can control global settings for your spreadsheet, like increasing font size and changing the date format. For some options that are not self-explanatory, there are tooltips that can be accessed by hovering the cursor.


9. Settings options


Cell contextual menu

You can right-click on every Visyond cell and access the contextual menu.

Through the contextual menu (or using the shortcut described in it), it is possible to perform fundamental operations on the cell:

Cell Menu
Cell Menu

Format (or Ctrl / Command + f) opens the formatting dialog.

Cases (or Ctrl / Command + k) brings up the Cases panel which contains your and/or your collaborators’ assumptions for that particular cell. As you work on your model you can switch between cases, and you can use the Overview tab to visualize all cases.

Cell Info (or Ctrl / Command + i) brings up the information (comments/attachments) associated with the cell. You can add comments or upload files to each cell from this pane.

Goal Seek (or Ctrl / Command + g) will take you to the Goal Seek panel where you can reverse engineer the value an input should have in order to generate a specific output value.

Dependencies  (or Ctrl / Command + d) brings up the dependencies panel. See the Precedents and Dependents section below for more details.

Scenarios

The Scenario Panel helps you manage different scenarios to run your model. Any collaborator can add scenarios to the model, and you can easily switch from one scenario to the next as you work on your model.

You can also change the cases making up a scenario and compare them all in the Overview and Scenario TAB.


6. Scenario Panel

Audit and custom formatting

Visyond offers the possibility to auto format cells when you activate the Audit mode. Cells will have a different format based on the type of data they contain and may display colored dots to indicate the presence of metadata.

Audit Mode Formatting as described in the in-app Hint panel


Here is an example of how this looks when you are working on a project.

Audit and custom formatting

If you toggle off the Audit mode you can format the cells in any way you wish.

Audit Mode: Precedents and Dependents

When in audit mode, you can quickly find out which cells will be affected (its dependents) when you change the value of the selected cell or which cells determine the value (its precedents) of the selected cell.


7 Precedents and dependents


You can also visually inspect the  precedents and dependencies of a cell clicking on the dependencies tab. The thickness of the lines in this visualization denotes how strongly one cell is influenced by its preceding cell.

8. Visual dependencies


Chat

Visyond has a chat feature where you can talk with your collaborators in real time as you work on your project. Chat will not be turned on if you are the only one working on the spreadsheet.

Chat

Conclusion

Our aim with Visyond has been to make modeling and data analysis in Visyond fast and error-free. Back up your analysis with ease, present to anyone with confidence, and spend less time staring at a spreadsheet.

Leave a Comment