How to run Dependency Analysis in Visyond
If you want to visualize how cells are connected and how their changes are important for their dependencies, you need the Dependency Analysis module.
It lets you navigate through different cells and shows how one cell quantitatively impacts its dependent cells. You will be able to know, without tampering with the grid, what is the variance of a cell when one of its precedent cells varies.
Dependency analysis gives you a bird’s eye view of your model in the same way Google Maps does of a neighborhood. It’s a powerful auditing tool, uncovering errors that would be otherwise painstaking to catch.
It’s also a slick presentation tool and lets you explain your model to clients and colleagues without walking them through rows and columns on a spreadsheet and possibly boring them to tears.
Using the Dependency Analysis
Click on the Dependencies tab at the top right of your screen to get started with dependencies analysis. In the Settings menu on the left, type a cell of interest or pick it from the grid.
Select for what percentage change you want to see the variance from a cell to its dependent.
Then click on Explore Dependencies.
This will display the selected cell with semicircles on its sides. The right semicircle (if present) indicates that the cell drives dependent cells. The left semicircle (if present) indicates that other cells drive the selected cell.
Click on the semicircles to expand or collapse the branches connecting cells.
You will see a tree-like structure of your model where the thickness of connections between different cells corresponds to the impact of the driver on the dependent cell.
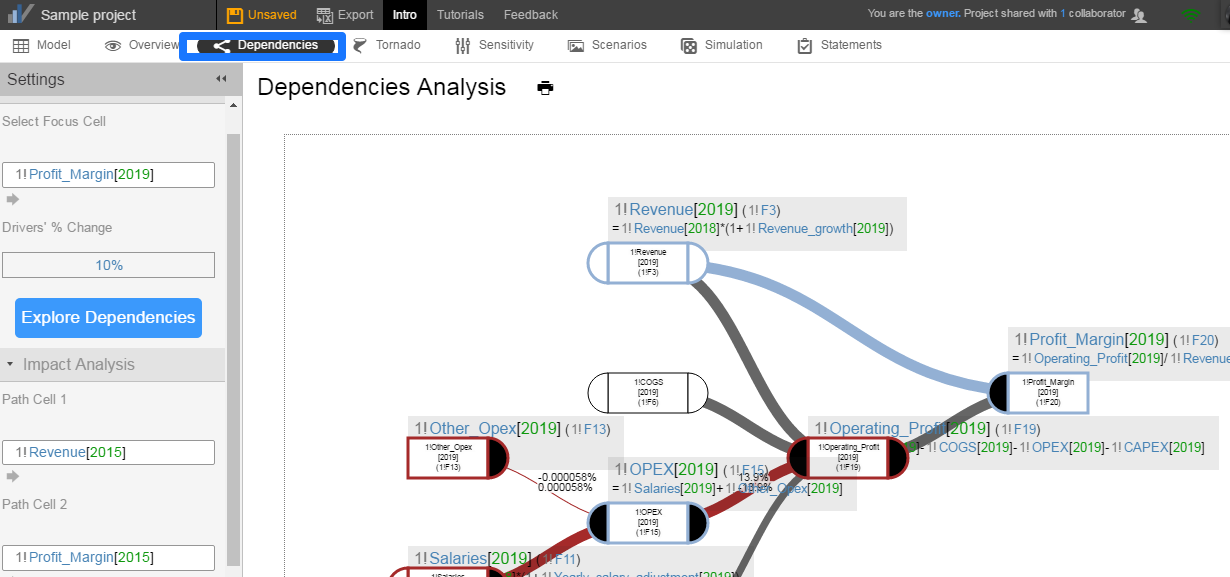
Hovering over a cell will give you more information about that cell and highlight the branches and cells connected to it. You can drag the cell information box to customise the area to print or save.
Hovering over the connectors will display the variance of the dependent cell connected to its precedent on that connector.
You can toggle the information of cells and connectors by clicking on them.
Right click on any cell will open the self-explanatory contextual menu.
You can run the analysis again after changing the driver % change or the focus cell.
When you are satisfied with your analysis you can print the tree map for reporting and presentation.
End-to-End Impact Analysis
Impact Analysis shows you the impact of a cell on any other cell.
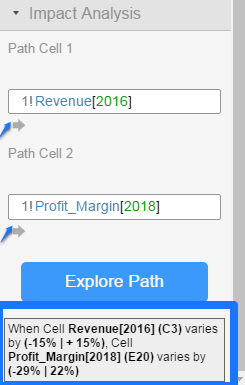
Select the % change in driver cell from Dependencies Analysis and select the two cells whose connection you want to explore.
Here we are selecting Revenue[2016] and Profit_Margin[2018]. Obviously the first cell must have the second cell as a direct or indirect dependent.
We want to find out how profit margin in 2018 will change if revenue in 2016 changes by 15%.
Upon entering the values and clicking on the Explore Path button we find that when revenue in 2016 varies by (15%/-15%) profit margin in 2018 changes by (22%/-29%)
Visual dependency analysis will save you time, uncover errors and make meetings more engaging (try it on a touch screen, your iPad or the digital TV in your meeting room).