In Visyond you can either use the traditional way spreadsheets projects values and formulas (by dragging the bottom-right square of a selected cell or range) or use convenient projection arrows.
Preparing the Grid
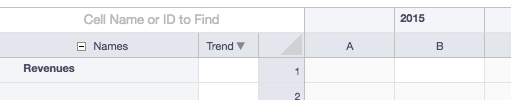
Let’s start by preparing the grid with a row (e.g., Revenues) and column (e.g., 2015) name. Make sure you have the Audit Mode on.
Observe how cell B1 is now white, indicating that data in the current worksheet can only be in that cell: the intersection of the populated rows and columns.
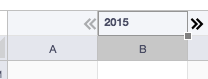
Let’s now select the column name and project by two periods to the right (up to 2017) by either dragging the bottom-right square to the right or clicking on the right arrow first in 2015 and then on the newly created 2016.
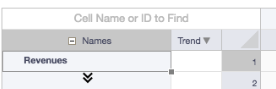
Do the same for the row name.
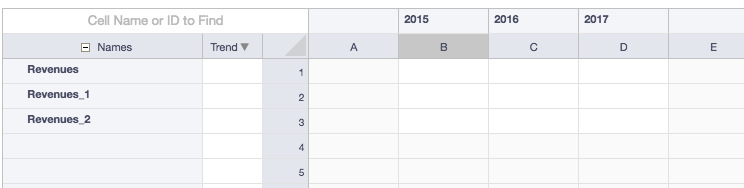
The grid looks like this:
Populated Area
We called the white area the ‘populated area’ because it indicates that outside we have the certainty there is no data: you do not have to worry to scroll up and down to check if you forgot some cells far away.
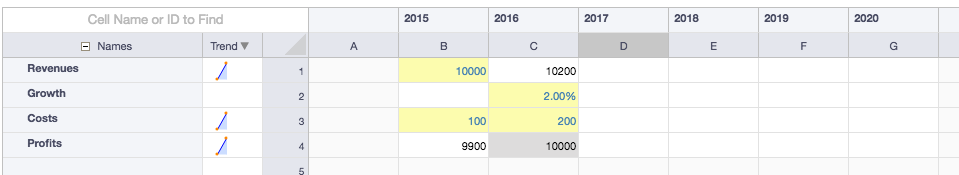
Let’s now extend the periods, rename the rows and add some data:
- Type 100000 in Revenue[2015] (B1)
- Type 100 in Costs[2015] (B3)
- Type the formula =Revenues[2015]-Costs[2015] (Visyond will autosuggest as you start typing or you can also type =B1-B3 and decide later if you want it display in this format or with natural names) in Profits[2015] (B4)
- Type =Revenues[2015]*(1+Growth[2016]) in Revenues[2016] (C1)
- Type 2% in Growth[2016]
- Select B3 and B4 and project them into C3 and C4 (note that if you keep Ctrl or Command pressed during this operation, numbers will not be filled and instead of 200 you would see 100 copied across)
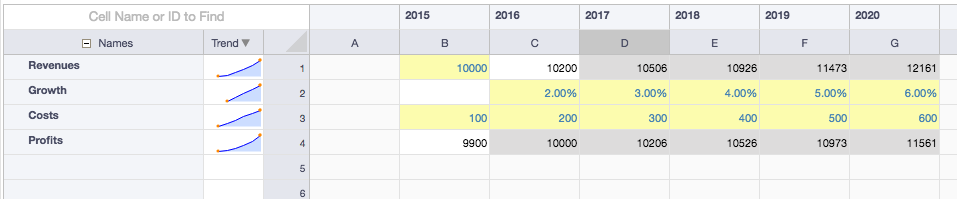
Projections
Now that you have your basic model architecture, if you want to project the entire column C to fill the model up to its final period, instead of selecting all the cells in the column, find the little square to drag (imagine when you have a lot of rows) and let your shaky mouse drag to the right.
You can simply hover column C and double click on the right arrow (a double click always fill the series up to the edges of the populated area).

To Summarize
- The projection arrows can replace the drag projection of classical spreadsheets
- One click on the arrow projects the cell / column / row by one cell / column / row
- Double click on the arrow projects the cell / column / row to fill the series up to the edge of the populated area
- If you keep Ctrl (or Command for Mac) while drag-project or clicking on a projection arrow, the values in the cells are not automatically filled (they are copied across)