Marketing and Sales: analyse and present the value of your offer
This tutorial will demonstrate how Visyond helps you build, analyse and present the value of your products and solutions via interactive online slides your clients can interact with, without risking to introduce bugs in the model.
This is the process you are likely following now:
- You or your modelers have built and audited a spreadsheet to show clients/stakeholders some value metrics (e.g., profits, ROI, savings, etc.)
- You “play” with assumptions while discussing with your stakeholders. Every time you change an assumption you either take a manual note of what was there before the change or lose it.
- If you have multiple stakeholders (e.g., different clients) you create N copies of the spreadsheet with different assumptions. You (or the modeler) have to spend time taking notes on which version is for whom, what changes have been made, etc.
- Maintenance is cumbersome and this process (multiple copies plus back and forth via email) is very error prone.
- You now have to show the results (for example, waterfall charts or grouped stack charts that can take a long time to prepare) to your stakeholders and most likely paste charts into Powerpoint: what if they want to test another set of assumptions while reviewing the presentation? They will call you, you will change the assumption or call the modeller, lose or misplace the previous assumptions unless, again, you engage in an intricate error-prone and data-loss-prone manual process, prepare another Powerpoint, etc. The turnaround time is long and resource draining for your organisation.
With Visyond, the process becomes the following:
- Import the model from Excel or build it from scratch in Visyond. Thanks to Visyond auditing functionality you have lower probability of undetected errors
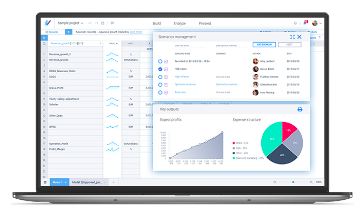
- One of the most powerful features within the Visyond Platform is Scenario management. You do NOT have to create copies of the model. Just share it with all the stakeholders with different permission levels so they can see and change assumptions based on the authority you assign to them.
Select a project, type in your colleagues’ email addresses and start working together on one spreadsheet, without risking losing your data or breaking formulae.
There is only one model in one place, very easy to maintain because all the changes are clearly tracked into scenarios (e.g., “Scenario client A”, “Scenario client B”, etc.) that you can compare and contrast for your internal analysis. Follow these steps to create a scenario:
- Click on the “R” button next to Scenarios to start “recording” a new scenario and name it (e.g., “Client A”, “Optimistic scenario”)
- Start typing values or formulae in cells. All these cells with their new Cases are now linked to your newly recorded Scenario.
- When you are finished editing cells, click “Stop Recording”. Now click on Scenarios to see the newly created scenario in the list – you can always go back to it and modify it.
Do you think you made a mistake in some assumptions, just revert to any scenario (or reset all to the base case assumptions by clicking “Reset” in the scenario panel) and record a new one starting from that cells configuration.
-
You do not have to take manual notes: all assumption changes, comments and attachments (yes, you can attach supporting material in Visyond’s cells) are automatically tracked in the Report Tab and ready to be printed as cover notes.
-
Create and share Visyond interactive slides: you empower your clients or stakeholders (a decision maker within your organisation who does not like to interact with spreadsheets) to test new assumptions and see the results in a clear and elegant environment (an online dashboard that you have designed), where they are not exposed to the spreadsheet complexities and cannot accidentally break or change the model. Decisions that took days or weeks to make, with information bouncing back and forth among multiple stakeholders, can be made much faster with a process that frees up a lot of your time and give you peace of mind because the model cannot be broken.

In summary, Visyond lets you:
- Work on one model (in one place) and store in it all information your team and clients build (it’s a knowledge management platform)
- Easily find errors (it’s an auditing and debugging platform)
- Track and revert any changes (it’s a governance platform preventing data chaos)
- Run sensitivities and simulations in real time (it’s an analytics and modeling platform)
- Present with impact to any audience (it’s an interactive presentation and reporting platform)