How to run Scenario analysis in Visyond
Scenario analysis shows how an output varies when inputs are driven by scenarios created.
Scenario Analysis uses Cases. When you and your collaborators have added multiple cases (assumptions) in some cells, you can combine any case combination into a scenario and compare instantly results under all the scenarios created.

In your Visyond spreadsheet you can create scenarios by clicking in the Scenarios button.
Inside the panel, you can switch to existing scenarios or create a new one by typing a name for the scenario and clicking on Add Scenario.
When the cases selected in the grid have been grouped in a scenario, on top of the grid it will be clearly displayed the scenario name. Also the charts will display the scenario name under the title so that you will not be wondering under which assumptions you took that printout.
So you can switch cases one at a time from the cases panel, or you can switch scenarios and observe how all the cases part of that scenario are set to the right value, making it a breeze to watch charts changing as scenarios are changed.
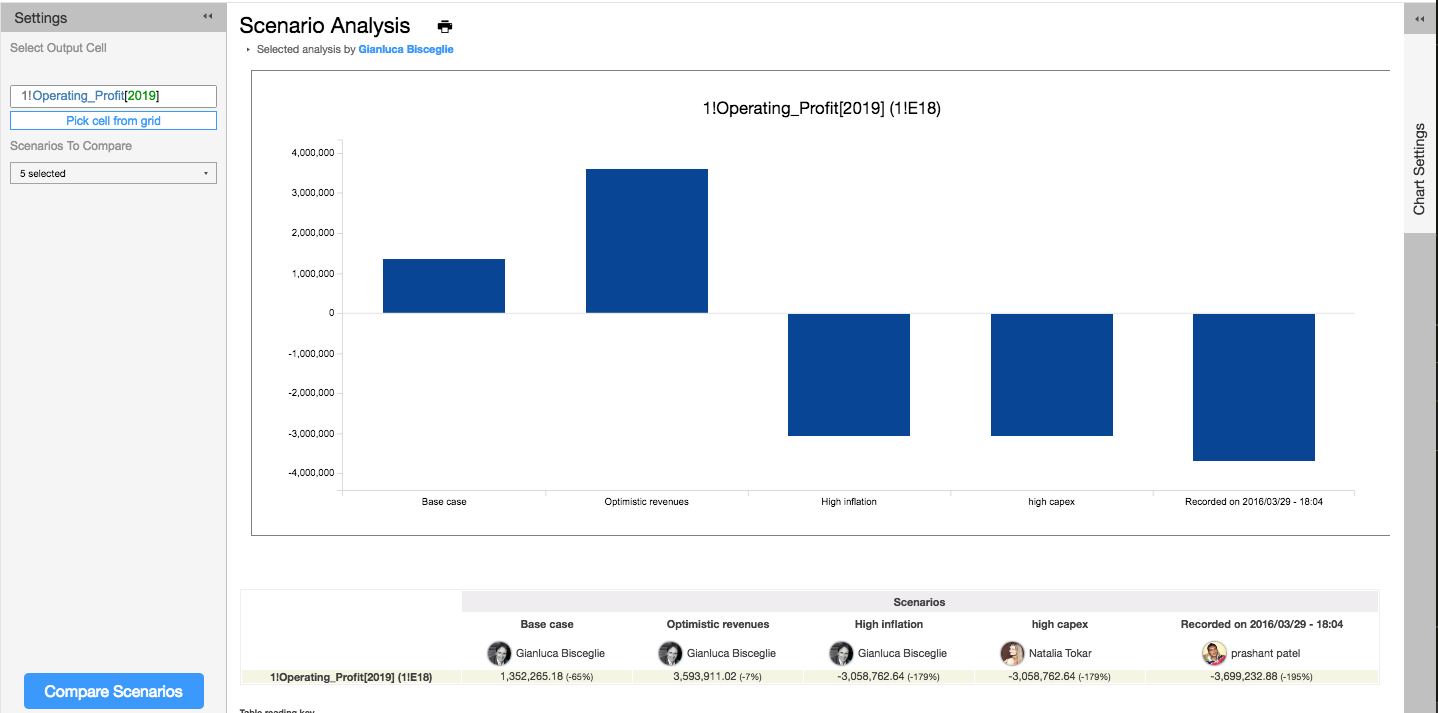
Clicking on the Scenario Tab, you can compare scenarios side by side, generating automatically a chart and a variance table ready to be printed or exported.
As usual, setting up this analysis requires only the selection of the output cell to analyse, selecting which scenarios to compare, and clicking Compare Scenarios.
This can be done on your tablet or smartphone.