Multiple assumptions can coexist in the same cell. The last added value does not overwrite the existing ones. Nobody, including the spreadsheet owner, can change data entered by others.
Overview
When working with a model you want to see how different inputs lead to different outputs. You do this by creating different scenarios which are in turn made up of different cases (assumptions / values in cells). Visyond greatly simplifies the task of managing assumptions by allowing you to record multiple values in one cell without overwriting other contributor’s data.
A case is a value or formula that a cell can take. Both cases and scenarios can be created by you or your collaborators but everyone can only edit the ones they create, so there is no risk to delete or break others’ work.
In this tutorial, we will show you how you can record multiple values in one cell and create & use cases in your model.
Creating a Case in Your Spreadsheet
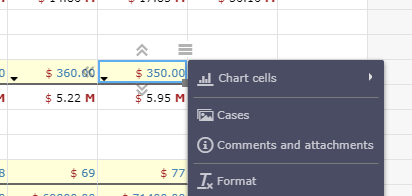
Click on any cell that has data in it, right click to open context menu, and select Cases.
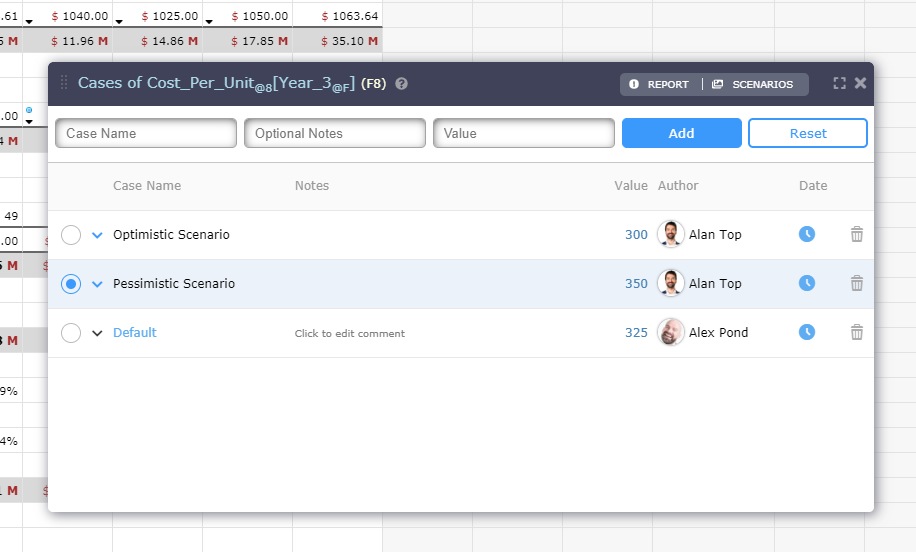
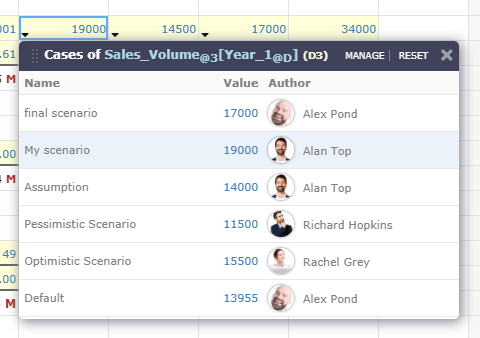
You can add multiple values in one cell from the case panel: simply add the name of the case, a comment (optional), and a value for the case.
See how the cell now displays a drop-down icon to indicate that it contains cases.
![]()
Auto-generated Cases
If you are editing a cell which is set on a case created by a collaborator (see below), Visyond will automatically create a new case. Cases will also be automatically created when you are in Scenario Recording mode.
Combining Cases into Scenarios
When you have cells with multiple cases, you may want to remember a specific spreadsheet configuration. You can take a “snapshot” of the cases selected in the grid by clicking on the Scenarios button.
Using Cases in Your Model
It’s extremely easy to see how cases affect the output of your model: click on different cases in the Case Panel, and watch the values of the dependent cells change.
In this example, observe how some values in the Year_1 column change as we change the value of the Sales_Volume[Year_1] cell.
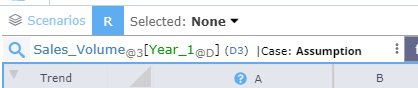
To find out which case is currently active, select the cell and see the case’s name next to the name of the cell (at the top left of your spreadsheet):
Or click on the drop-down icon in the cell:
Charts and Cases
In order to visualize how cases impact the output of the model click on the Charts button to open the Charts popup window.
As you switch between different cases you will see how the change propagates through your model.
Following our previous example I want to see how changes in the Sales_Volume[Year_1] cell affect the Profit – Year_1 chart. I will switch between the radio buttons in the Case panel, and see the change reflected in the Charts window.
Cases and Collaboration
If your project is shared, your colleagues can create their own cases for every cell that has data in it, and repeat the same operations as above.
The Case Panel will also have the assumptions that your collaborators create under their name. These cases can’t be edited by anybody (including the project owner), preventing accidental data corruption and promoting accountability.
In order to see all the cells that have cases in them click on the Report/Overview tab at the top left, and check out the list of cells with the names of the cases, name of the author, value of the cases, and date on which they were created.
